Evaluate Differential Correlation between two subsets of data
Usage
evalDiffCorr(
  epiSignal,
  testVariable,
  gRanges,
  clustList,
  npermute = c(100, 10000, 1e+05),
  adj.beta = 0,
  rho = 0,
  sumabs.seq = 1,
  BPPARAM = bpparam(),
  method = c("sLED", "Box", "Box.permute", "Steiger.fisher", "Steiger", "Jennrich",
    "Factor", "Mann.Whitney", "Kruskal.Wallis", "Cai.max", "Chang.maxBoot", "LC.U",
    "WL.randProj", "Schott.Frob", "Delaneau", "deltaSLE"),
  method.corr = c("pearson", "kendall", "spearman")
)

# S4 method for EList,ANY,GRanges,list
evalDiffCorr(
  epiSignal,
  testVariable,
  gRanges,
  clustList,
  npermute = c(100, 10000, 1e+05),
  adj.beta = 0,
  rho = 0,
  sumabs.seq = 1,
  BPPARAM = bpparam(),
  method = c("sLED", "Box", "Box.permute", "Steiger.fisher", "Steiger", "Jennrich",
    "Factor", "Mann.Whitney", "Kruskal.Wallis", "Cai.max", "Chang.maxBoot", "LC.U",
    "WL.randProj", "Schott.Frob", "Delaneau", "deltaSLE"),
  method.corr = c("pearson", "kendall", "spearman")
)

# S4 method for matrix,ANY,GRanges,list
evalDiffCorr(
  epiSignal,
  testVariable,
  gRanges,
  clustList,
  npermute = c(100, 10000, 1e+05),
  adj.beta = 0,
  rho = 0,
  sumabs.seq = 1,
  BPPARAM = bpparam(),
  method = c("sLED", "Box", "Box.permute", "Steiger.fisher", "Steiger", "Jennrich",
    "Factor", "Mann.Whitney", "Kruskal.Wallis", "Cai.max", "Chang.maxBoot", "LC.U",
    "WL.randProj", "Schott.Frob", "Delaneau", "deltaSLE"),
  method.corr = c("pearson", "kendall", "spearman")
)

# S4 method for data.frame,ANY,GRanges,list
evalDiffCorr(
  epiSignal,
  testVariable,
  gRanges,
  clustList,
  npermute = c(100, 10000, 1e+05),
  adj.beta = 0,
  rho = 0,
  sumabs.seq = 1,
  BPPARAM = bpparam(),
  method = c("sLED", "Box", "Box.permute", "Steiger.fisher", "Steiger", "Jennrich",
    "Factor", "Mann.Whitney", "Kruskal.Wallis", "Cai.max", "Chang.maxBoot", "LC.U",
    "WL.randProj", "Schott.Frob", "Delaneau", "deltaSLE"),
  method.corr = c("pearson", "kendall", "spearman")
)
Arguments
- epiSignal
matrix or EList of epigentic signal. Rows are features and columns are samples
- testVariable
factor indicating two subsets of the samples to compare
- gRanges
GenomciRanges corresponding to the rows of epiSignal
- clustList
list of cluster assignments
- npermute
array of two entries with min and max number of permutations
- adj.beta
parameter for sLED
- rho
a large positive constant such that A(X)-A(Y)+diag(rep(rho,p)) is positive definite. Where p is the number of features
- sumabs.seq
sparsity parameter
- BPPARAM
parameters for parallel evaluation
- method
"sLED", "Box", "Box.permute", "Steiger.fisher", "Steiger", "Jennrich", "Factor", "Mann.Whitney", "Kruskal.Wallis", "Cai.max", "Chang.maxBoot", "LC.U", "WL.randProj", "Schott.Frob", "Delaneau", "deltaSLE"
- method.corr
Specify type of correlation: "pearson", "kendall", "spearman"
Details
Correlation sturucture between two subsets of the data is evaluated with sparse-Leading-Eigenvalue-Driven (sLED) test:
Zhu, Lingxue, Jing Lei, Bernie Devlin, and Kathryn Roeder. 2017. Testing high-dimensional covariance matrices, with application to detecting schizophrenia risk genes. Annals of Applied Statistics. 11:3 1810-1831. doi:10.1214/17-AOAS1062
Examples
library(GenomicRanges)
library(EnsDb.Hsapiens.v86)
# load data
data('decorateData')
# load gene locations
ensdb = EnsDb.Hsapiens.v86
# Evaluate hierarchical clsutering
treeList = runOrderedClusteringGenome( simData, simLocation )
#>
Evaluating:chr20
#>
# Choose cutoffs and return clusters
treeListClusters = createClusters( treeList, method = "meanClusterSize", meanClusterSize=c( 10, 20) )
#> Method:meanClusterSize
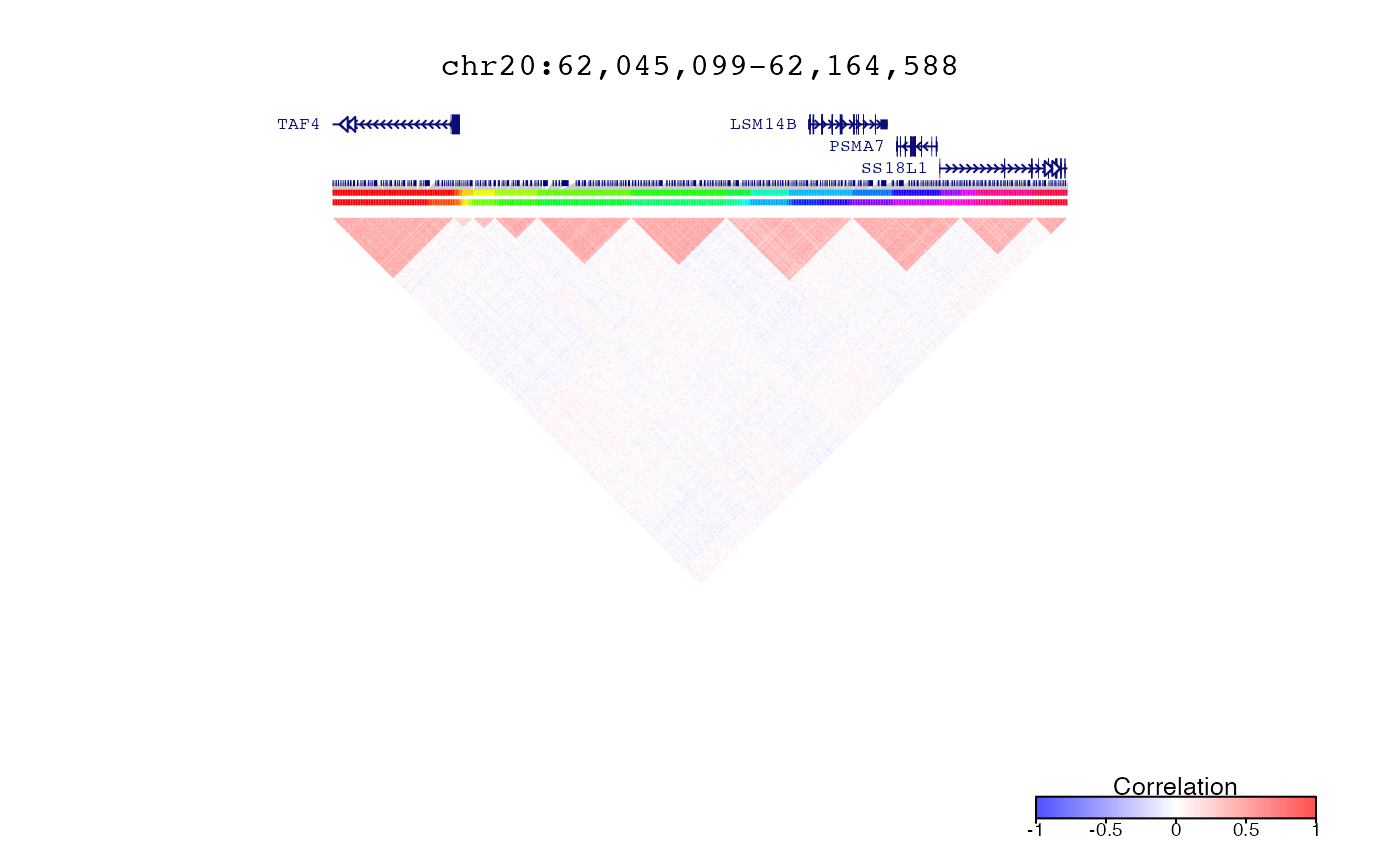
# Plot correlations and clusters in region defined by query
query = range(simLocation)
# Plot clusters
plotDecorate( ensdb, treeList, treeListClusters, simLocation, query)
 # Evaluate Differential Correlation between two subsets of data
sledRes = evalDiffCorr( simData, metadata$Disease, simLocation, treeListClusters, npermute=c(20, 200, 2000))
#> Note that clusters of 2 or fewer features are omitted from analysis
#>
#> # Clusters:67
#> Initial pass through all clusters...
#> Intensive second pass...
#> Combining results...
#>
# get summary of results
df = summary( sledRes )
# print results
head(df)
#> id chrom cluster pValue stat n.perm p.adjust
#> 1 20 chr20 4 0.0004997501 -2.1949654 2000 0.006163585
#> 2 10 chr20 4 0.0004997501 -0.7501589 2000 0.006163585
#> 3 20 chr20 2 0.0004997501 -0.7501589 2000 0.006163585
#> 4 10 chr20 14 0.1343283582 0.1434676 200 0.813186813
#> 5 10 chr20 40 0.1592039801 -0.3653258 200 0.813186813
#> 6 20 chr20 19 0.1592039801 -0.3653258 200 0.813186813
# extract peak ID's from most significant cluster
peakIDs = getFeaturesInCluster( treeListClusters, df$chrom[1], df$cluster[1], "20")
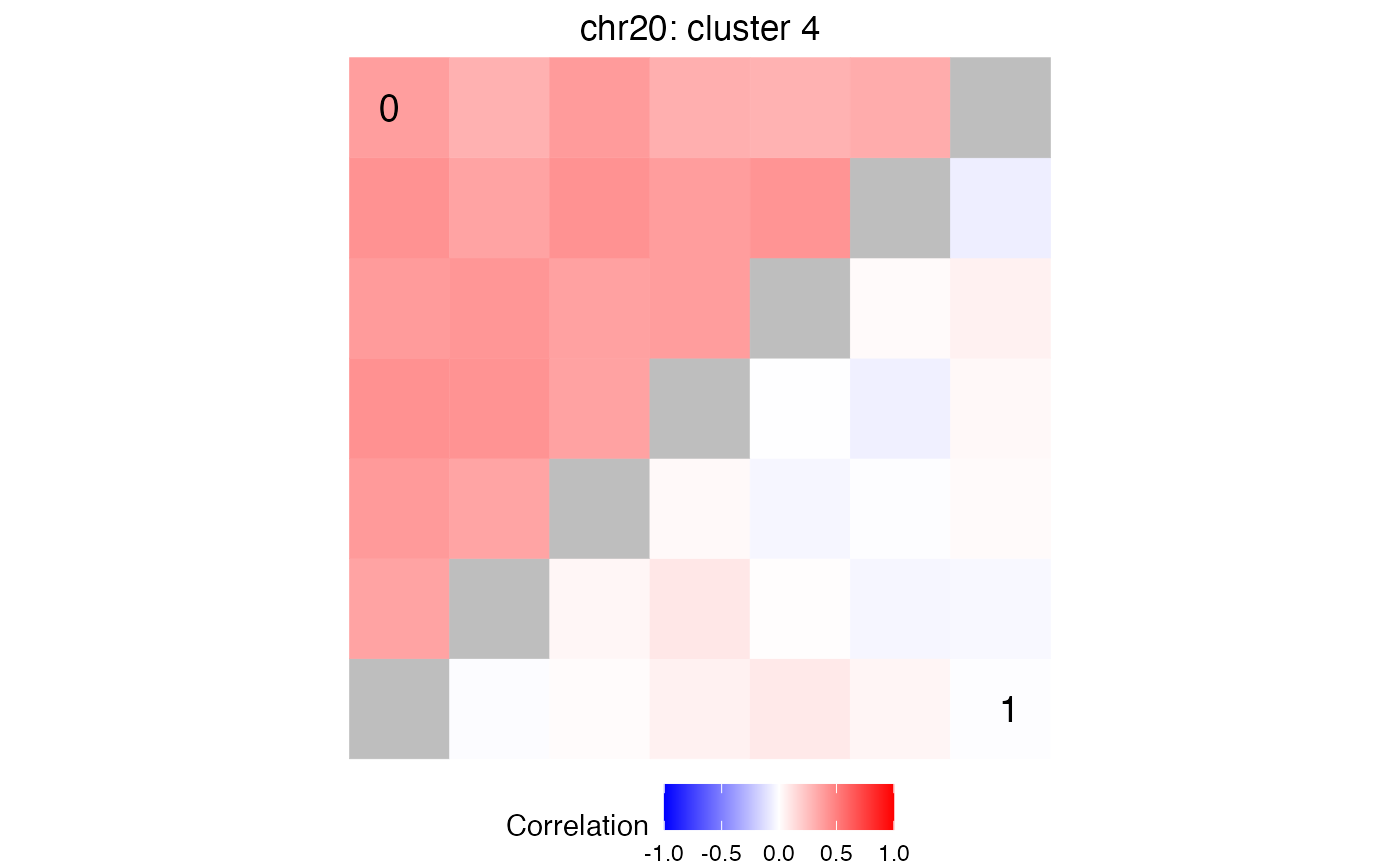
# plot comparison of correlation matrices for peaks in peakIDs
# where data is subset by metadata$Disease
main = paste0(df$chrom[1], ': cluster ', df$cluster[1])
plotCompareCorr( simData, peakIDs, metadata$Disease) + ggtitle(main)
# Evaluate Differential Correlation between two subsets of data
sledRes = evalDiffCorr( simData, metadata$Disease, simLocation, treeListClusters, npermute=c(20, 200, 2000))
#> Note that clusters of 2 or fewer features are omitted from analysis
#>
#> # Clusters:67
#> Initial pass through all clusters...
#> Intensive second pass...
#> Combining results...
#>
# get summary of results
df = summary( sledRes )
# print results
head(df)
#> id chrom cluster pValue stat n.perm p.adjust
#> 1 20 chr20 4 0.0004997501 -2.1949654 2000 0.006163585
#> 2 10 chr20 4 0.0004997501 -0.7501589 2000 0.006163585
#> 3 20 chr20 2 0.0004997501 -0.7501589 2000 0.006163585
#> 4 10 chr20 14 0.1343283582 0.1434676 200 0.813186813
#> 5 10 chr20 40 0.1592039801 -0.3653258 200 0.813186813
#> 6 20 chr20 19 0.1592039801 -0.3653258 200 0.813186813
# extract peak ID's from most significant cluster
peakIDs = getFeaturesInCluster( treeListClusters, df$chrom[1], df$cluster[1], "20")
# plot comparison of correlation matrices for peaks in peakIDs
# where data is subset by metadata$Disease
main = paste0(df$chrom[1], ': cluster ', df$cluster[1])
plotCompareCorr( simData, peakIDs, metadata$Disease) + ggtitle(main)