Evaluate the decay of correlation versus distance between features
Source:R/evaluateCorrDecay.R
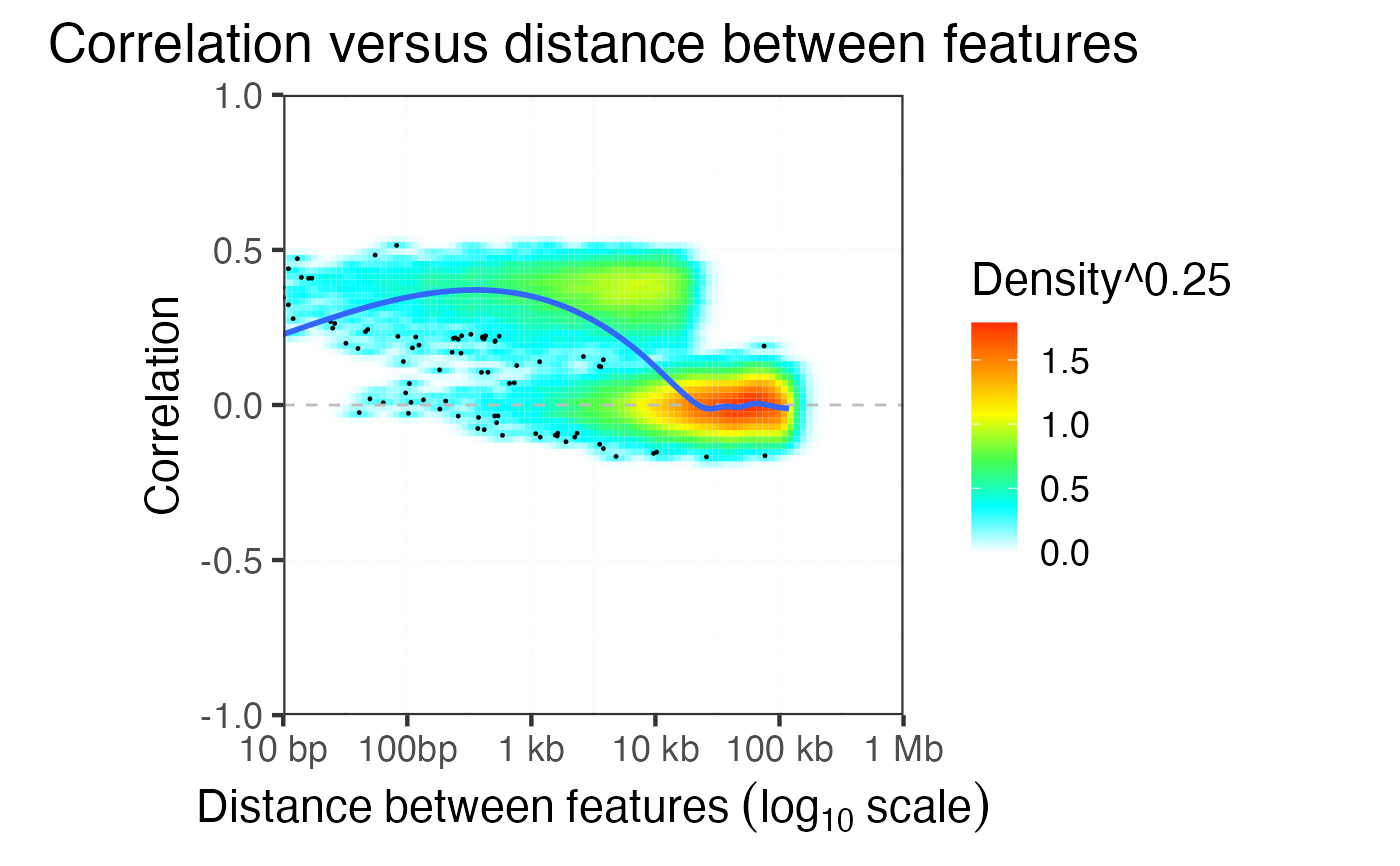
evaluateCorrDecay.RdFor pairs of features evaluate the physical distance and the correlation
Usage
evaluateCorrDecay(treeList, gr, chromArray = seqlevels(gr), verbose = TRUE)Arguments
- treeList
list of hclust objects
- gr
GenomicRanges object corresponding to features clustered in treeList
- chromArray
Use this only this set of chromosmes. Can substantially reduce memory usage
- verbose
show progress
Value
a data.frame of distance and correlation value for all pairs of features already evalauted in treeList. Note that runOrderedClusteringGenome() that returns treeList only evalutes correlation between a specified number of adjacent peaks
Examples
library(GenomicRanges)
library(ggplot2)

data('decorateData')

# Evaluate hierarchical clustering
treeList = runOrderedClusteringGenome( simData, simLocation )
#>
Evaluating:chr20
#>

# Evaluate how correlation between features decays with distance
dfDist = evaluateCorrDecay( treeList, simLocation )
#>
chr20
#>

# make plot
plotCorrDecay( dfDist )
#> Scale for y is already present.
#> Adding another scale for y, which will replace the existing scale.
#> Scale for x is already present.
#> Adding another scale for x, which will replace the existing scale.
#> Warning: The dot-dot notation (`..density..`) was deprecated in ggplot2 3.4.0.
#> ℹ Please use `after_stat(density)` instead.
#> ℹ The deprecated feature was likely used in the decorate package.
#>   Please report the issue at
#>   <https://github.com/DiseaseNeuroGenomics/decorate/issues>.
#> Warning: Removed 23 rows containing non-finite values (`stat_density2d()`).
#> `geom_smooth()` using method = 'gam' and formula = 'y ~ s(x, bs = "cs")'
#> Warning: Removed 23 rows containing non-finite values (`stat_smooth()`).
#> Warning: Removed 396 rows containing missing values (`geom_tile()`).
#> Warning: Removed 15 rows containing missing values (`geom_point()`).