R/plots.R
plotClusterSegments.Rd
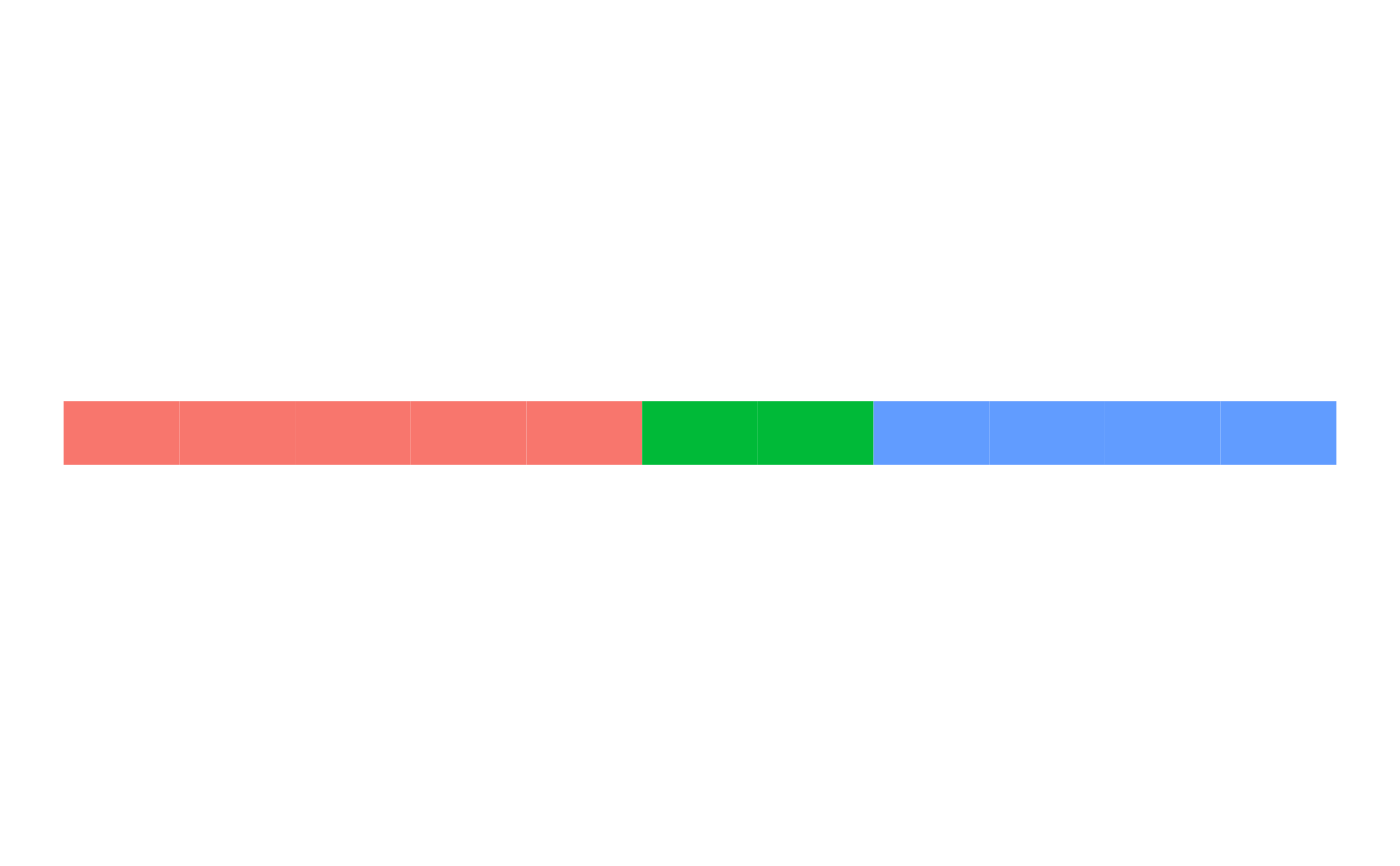
Plot bar of segments showing clusters
plotClusterSegments(clusterValues)
array of names of cluster for each entry
ggplot2 of cluster assignments
plotClusterSegments(c(rep(1, 5), rep(2,2), rep(3, 4)))