Skip to contents

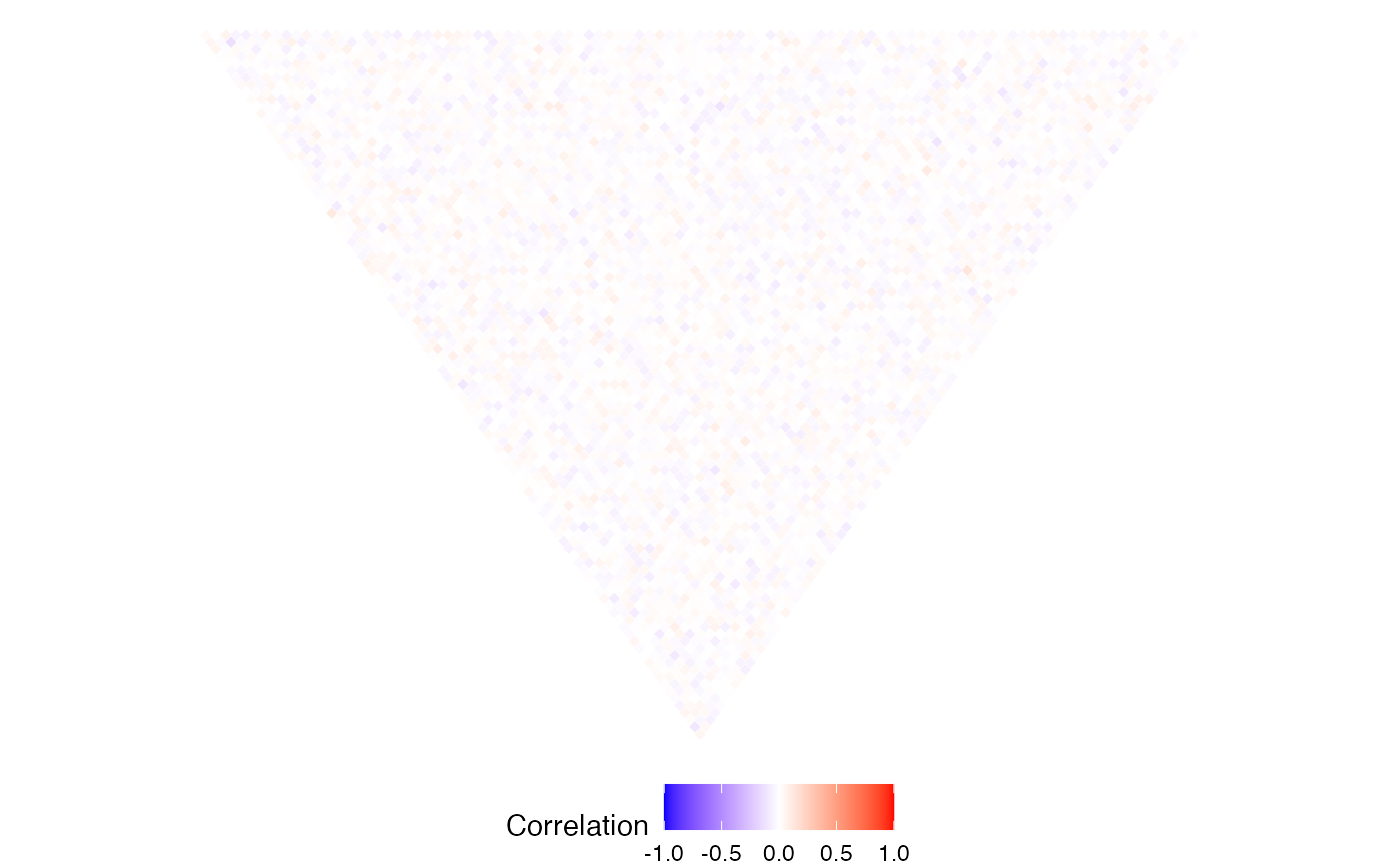
Plot lower triangle of correlation matrix

Usage

plotCorrTriangle(
  C,
  size = 1,
  stroke = 1.5,
  cols = c("blue", "white", "red"),
  absCorr = FALSE
)

Arguments

C

correlation matrix

size

plotting argument to geom_point()

stroke

plotting argument to geom_point()

cols

array of two colors for gradient

absCorr

show absolute correlations

Value

ggplot2 plot of correlation matrix

Details

Adjust size and stroke of points in the plot to fix look of plot depending on dimensions

Examples

N = 1000
p = 100
X = matrix(rnorm(N*p), N,p)
C = cor(X)
plotCorrTriangle( C )