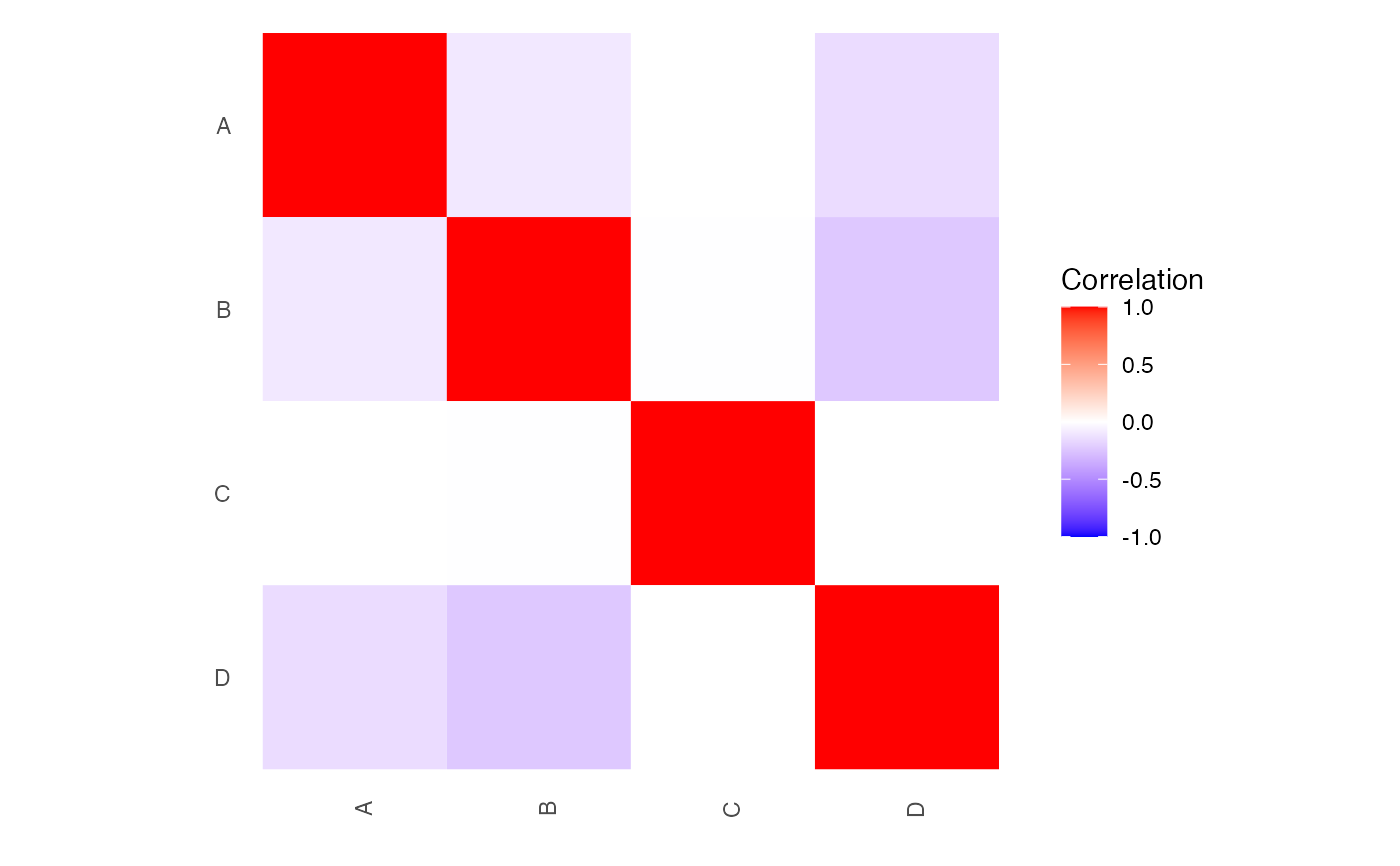
Correlation plot
Examples
# Generate effects
library(mvtnorm)
library(clusterGeneration )

n = 4
Sigma = cov2cor(genPositiveDefMat(n)$Sigma)
beta = t(rmvnorm(1, rep(0, n), Sigma))
stders = rep(.1, n)

# set names
rownames(Sigma) = colnames(Sigma) = LETTERS[1:n]
rownames(beta) = names(stders) = LETTERS[1:n]

# Run random effects meta-analysis,
# account for correlation
RE2C( beta, stders, Sigma)
#>         stat1    stat2        RE2Cp RE2Cp.twoStep       QE          QEp
#> 1 0.000629065 148.7278 1.725611e-33            NA 158.4847 5.344307e-34
#>        Isq
#> 1 98.01431

# Make plot
plotCor( Sigma )