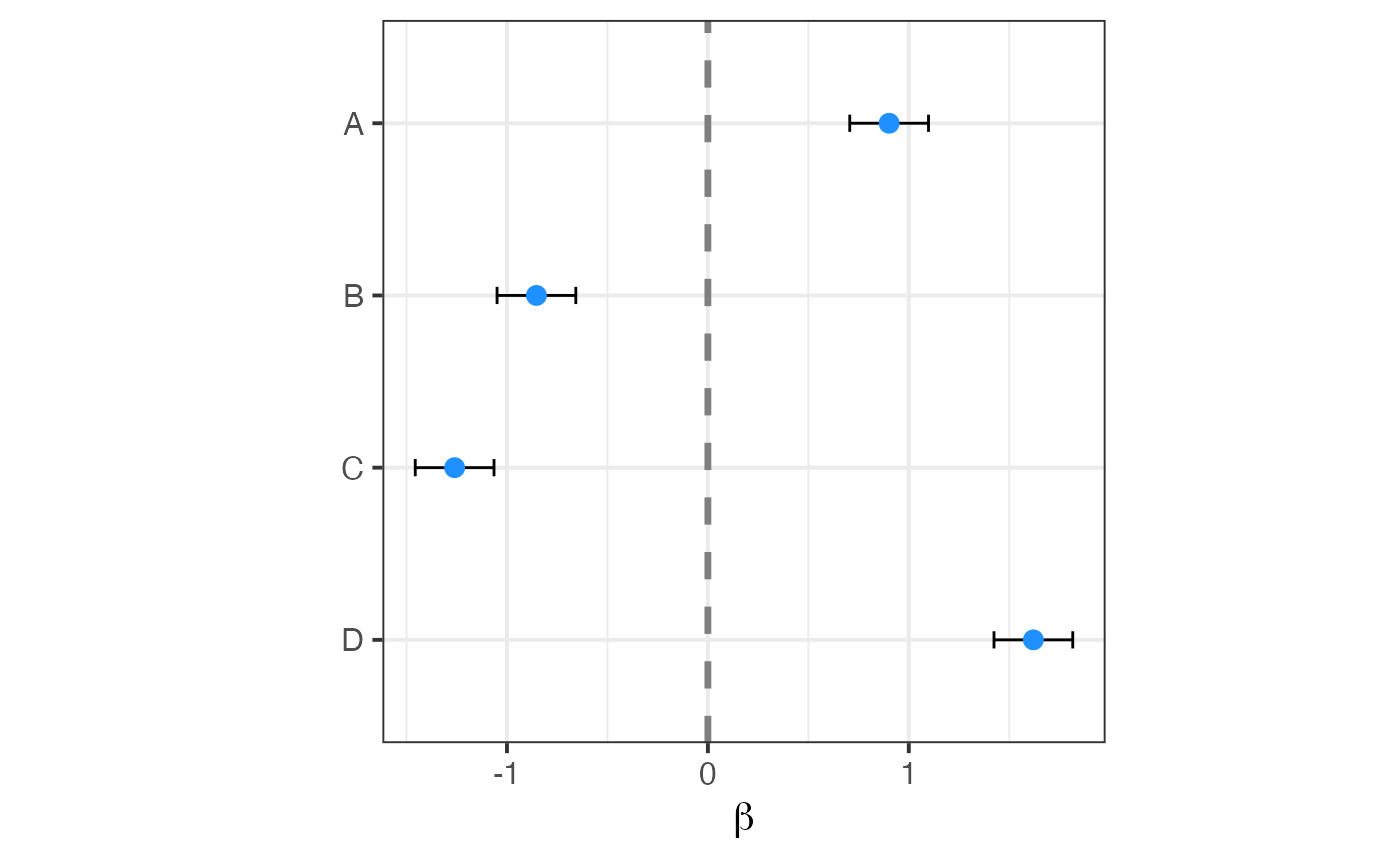
Forest plot of coefficients
Examples
# Generate effects
library(mvtnorm)
library(clusterGeneration )

n = 4
Sigma = cov2cor(genPositiveDefMat(n)$Sigma)
beta = t(rmvnorm(1, rep(0, n), Sigma))
stders = rep(.1, n)

# set names
rownames(Sigma) = colnames(Sigma) = LETTERS[1:n]
rownames(beta) = names(stders) = LETTERS[1:n]

# Run random effects meta-analysis,
# account for correlation
RE2C( beta, stders, Sigma)
#>      stat1    stat2       RE2Cp RE2Cp.twoStep       QE          QEp      Isq
#> 1 48.03552 196.3024 2.75259e-54            NA 219.7931 7.618391e-48 98.83897

# Make plot
plotForest( beta, stders )