Perform a competitive gene set analysis accounting for correlation between genes.
Usage
zenith_gsa(
  fit,
  geneSets,
  coefs,
  use.ranks = FALSE,
  n_genes_min = 10,
  inter.gene.cor = 0.01,
  progressbar = TRUE,
  ...
)

# S4 method for MArrayLM,GeneSetCollection
zenith_gsa(
  fit,
  geneSets,
  coefs,
  use.ranks = FALSE,
  n_genes_min = 10,
  inter.gene.cor = 0.01,
  progressbar = TRUE,
  ...
)
Arguments
- fit
results from
dream()- geneSets
GeneSetCollection- coefs
list of coefficients to test using
topTable(fit, coef=coefs[[i]])- use.ranks
do a rank-based test
TRUEor a parametric testFALSE? default: FALSE- n_genes_min
minumum number of genes in a geneset
- inter.gene.cor
if NA, estimate correlation from data. Otherwise, use specified value
- progressbar
if TRUE, show progress bar
- ...
other arguments
Details
This code adapts the widely used camera() analysis (Wu and Smyth 2012)
in the limma package (Ritchie et al. 2015)
to the case of linear (mixed) models used by variancePartition::dream().
References
Ritchie ME, Phipson B, Wu DI, Hu Y, Law CW, Shi W, Smyth GK (2015).
“limma powers differential expression analyses for RNA-sequencing and microarray studies.”
Nucleic acids research, 43(7), e47--e47.
Wu D, Smyth GK (2012).
“Camera: a competitive gene set test accounting for inter-gene correlation.”
Nucleic acids research, 40(17), e133.
doi:10.1093/nar/gks461
.
Examples
# Load packages
library(edgeR)
library(variancePartition)
library(tweeDEseqCountData)
# Load RNA-seq data from LCL's
data(pickrell)
geneCounts = exprs(pickrell.eset)
df_metadata = pData(pickrell.eset)
# Filter genes
# Note this is low coverage data, so just use as code example
dsgn = model.matrix(~ gender, df_metadata)
keep = filterByExpr(geneCounts, dsgn, min.count=5)
# Compute library size normalization
dge = DGEList(counts = geneCounts[keep,])
dge = calcNormFactors(dge)
# Estimate precision weights using voom
vobj = voomWithDreamWeights(dge, ~ gender, df_metadata)
# Apply dream analysis
fit = dream(vobj, ~ gender, df_metadata)
fit = eBayes(fit)
# Load Hallmark genes from MSigDB
# use gene 'SYMBOL', or 'ENSEMBL' id
# use get_GeneOntology() to load Gene Ontology
gs = get_MSigDB("H", to="ENSEMBL")
# Run zenith analysis
res.gsa = zenith_gsa(fit, gs, 'gendermale', progressbar=FALSE )
# Show top gene sets
head(res.gsa, 2)
#> coef
#> M5890_HALLMARK_TNFA_SIGNALING_VIA_NFKB gendermale
#> M5892_HALLMARK_CHOLESTEROL_HOMEOSTASIS gendermale
#> Geneset
#> M5890_HALLMARK_TNFA_SIGNALING_VIA_NFKB M5890_HALLMARK_TNFA_SIGNALING_VIA_NFKB
#> M5892_HALLMARK_CHOLESTEROL_HOMEOSTASIS M5892_HALLMARK_CHOLESTEROL_HOMEOSTASIS
#> NGenes Correlation delta se
#> M5890_HALLMARK_TNFA_SIGNALING_VIA_NFKB 118 0.01 -0.9999389 0.1621467
#> M5892_HALLMARK_CHOLESTEROL_HOMEOSTASIS 37 0.01 -1.0915363 0.2296170
#> p.less p.greater PValue
#> M5890_HALLMARK_TNFA_SIGNALING_VIA_NFKB 2.268956e-08 1.0000000 4.537911e-08
#> M5892_HALLMARK_CHOLESTEROL_HOMEOSTASIS 5.493684e-06 0.9999945 1.098737e-05
#> Direction FDR
#> M5890_HALLMARK_TNFA_SIGNALING_VIA_NFKB Down 2.132818e-06
#> M5892_HALLMARK_CHOLESTEROL_HOMEOSTASIS Down 2.582032e-04
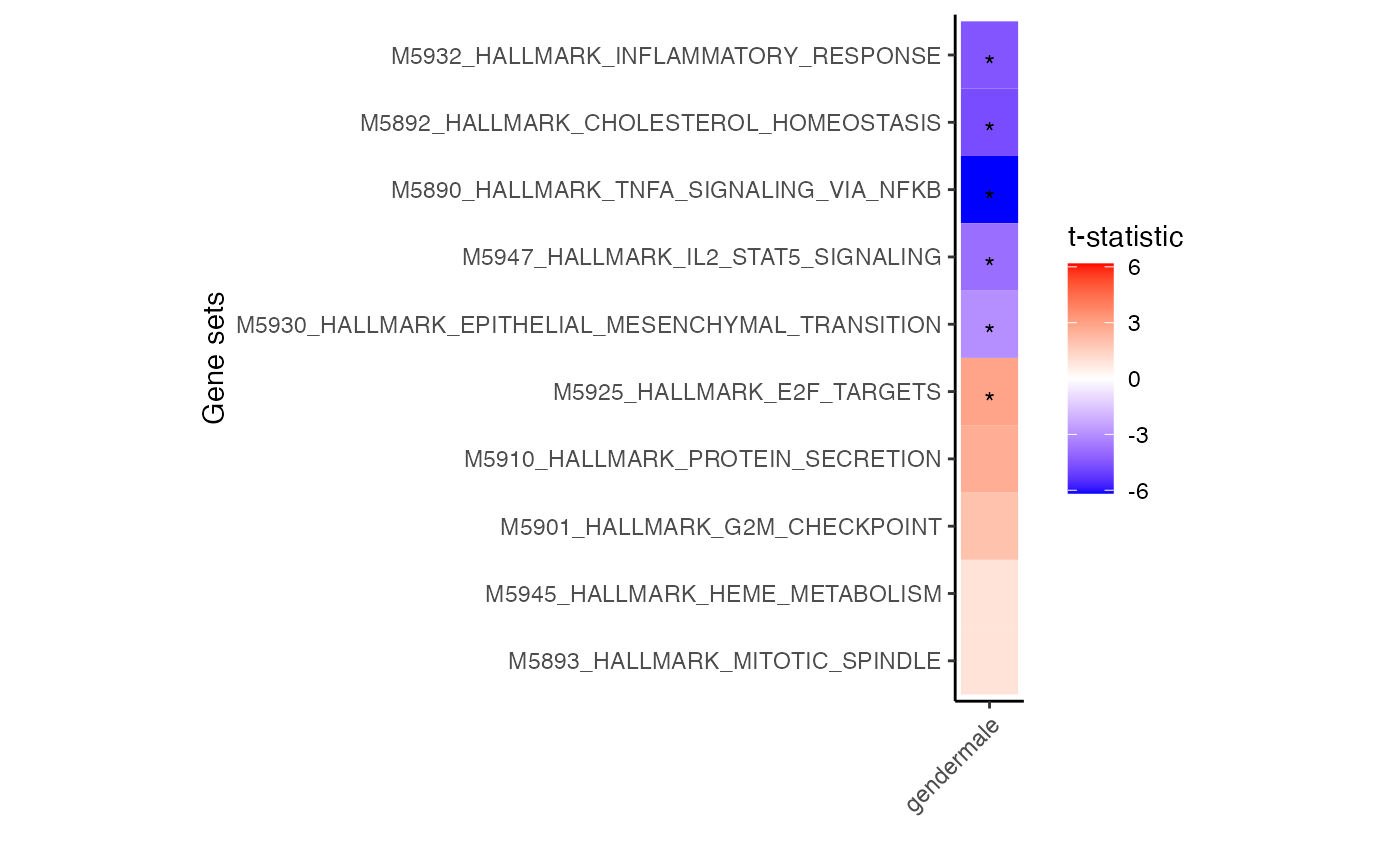
# for each cell type select 3 genesets with largest t-statistic
# and 1 geneset with the lowest
# Grey boxes indicate the gene set could not be evaluted because
# to few genes were represented
plotZenithResults(res.gsa)