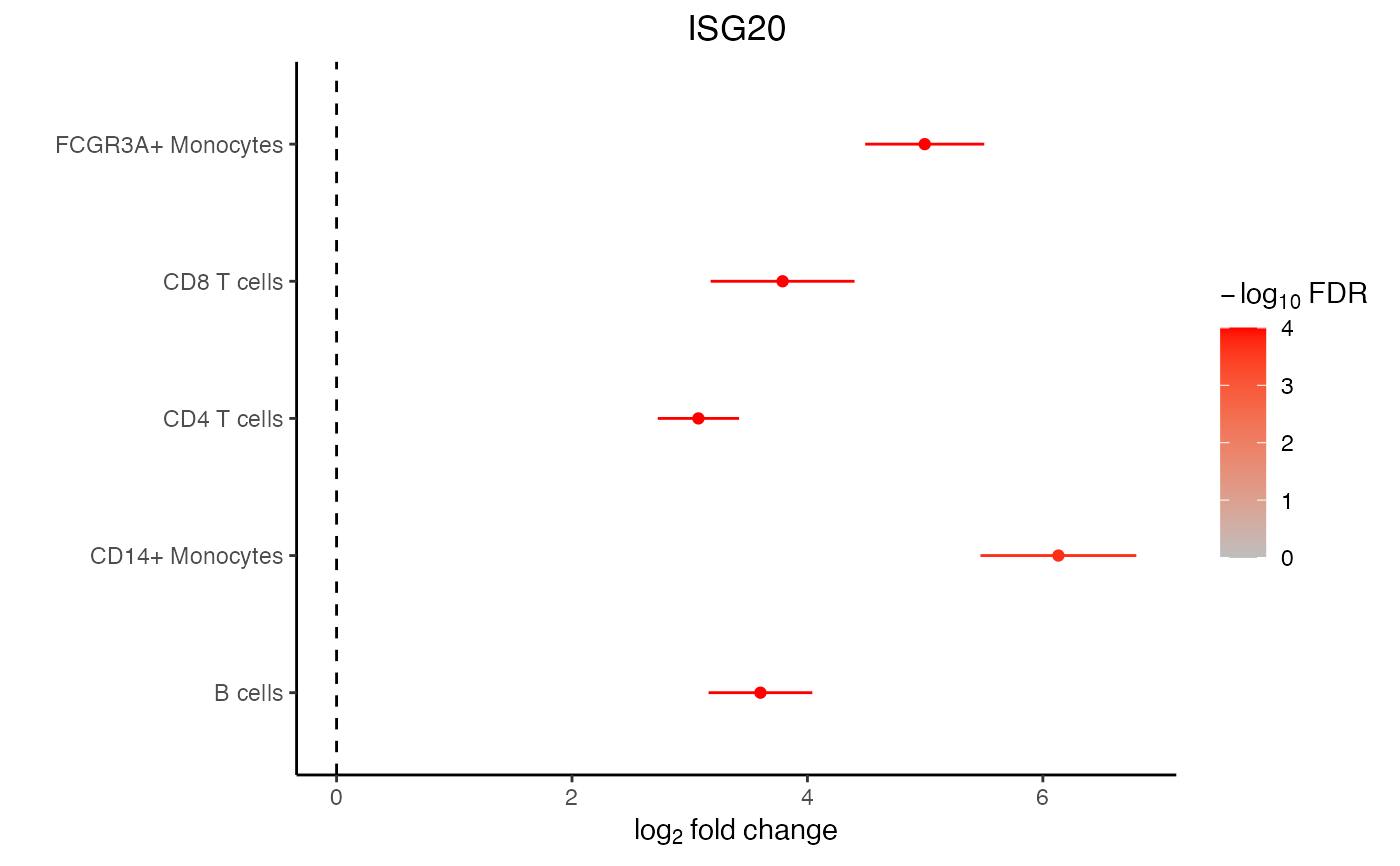
Forest plot
Examples
library(muscat)
library(SingleCellExperiment)

data(example_sce)

# create pseudobulk for each sample and cell cluster
pb <- aggregateToPseudoBulk(example_sce,
  assay = "counts",
  cluster_id = "cluster_id",
  sample_id = "sample_id",
  verbose = FALSE
)

# voom-style normalization
res.proc <- processAssays(pb, ~group_id)
#>   B cells...
#> 0.053 secs
#>   CD14+ Monocytes...
#> 0.086 secs
#>   CD4 T cells...
#> 0.069 secs
#>   CD8 T cells...
#> 0.037 secs
#>   FCGR3A+ Monocytes...
#> 0.079 secs

# Differential expression analysis within each assay,
# evaluated on the voom normalized data
res.dl <- dreamlet(res.proc, ~group_id)
#>   B cells...
#> 0.048 secs
#>   CD14+ Monocytes...
#> 0.063 secs
#>   CD4 T cells...
#> 0.052 secs
#>   CD8 T cells...
#> 0.038 secs
#>   FCGR3A+ Monocytes...
#> 0.06 secs

# show coefficients estimated for each cell type
coefNames(res.dl)
#> [1] "(Intercept)"  "group_idstim"

# Show estimated log fold change with in each cell type
plotForest(res.dl, gene = "ISG20", coef = "group_idstim")