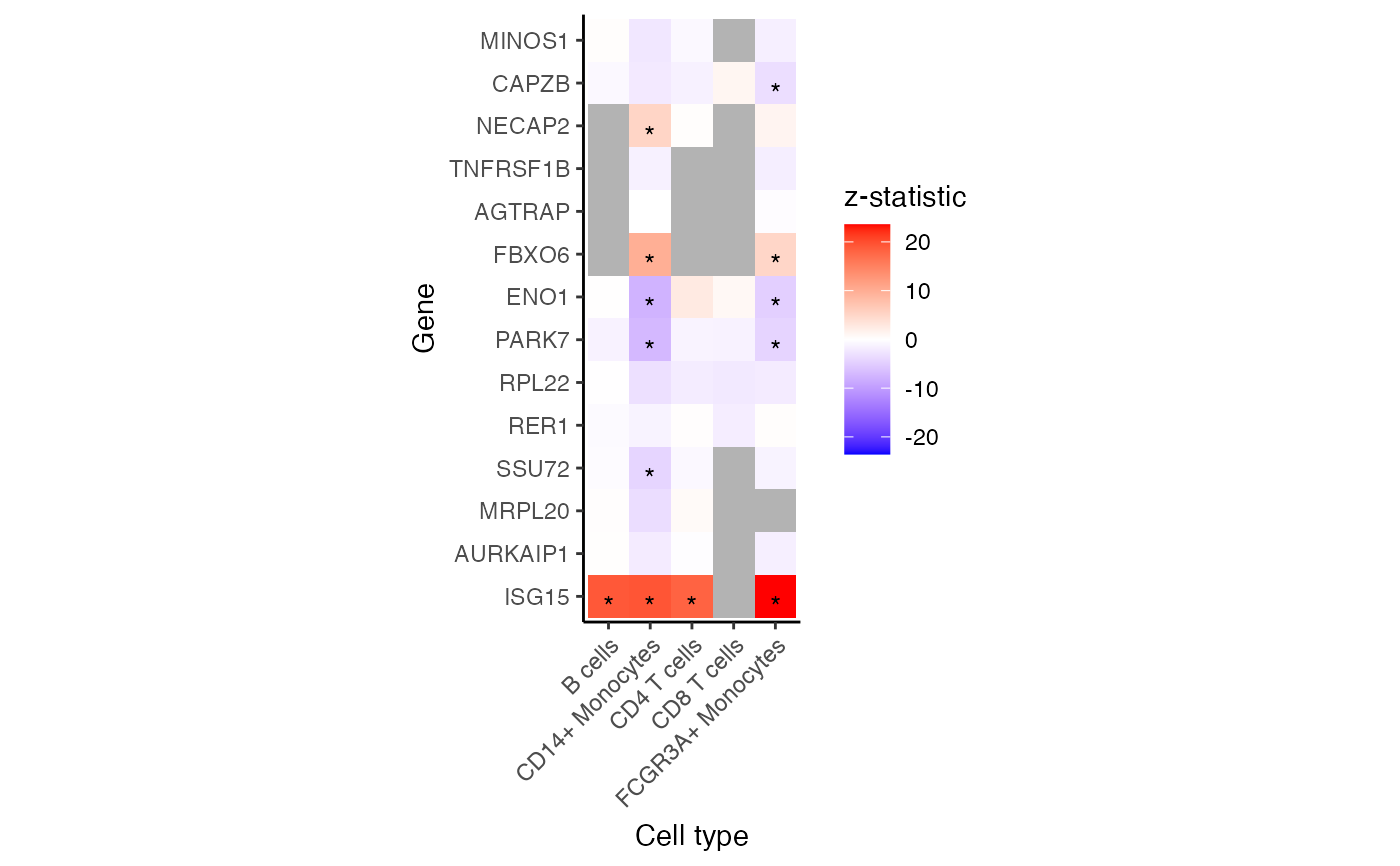
Heatmap of genes and assays
Usage
plotGeneHeatmap(
  x,
  coef,
  genes,
  assays = assayNames(x),
  zmax = NULL,
  transpose = FALSE
)

# S4 method for class 'dreamletResult'
plotGeneHeatmap(
  x,
  coef,
  genes,
  assays = assayNames(x),
  zmax = NULL,
  transpose = FALSE
)
Arguments
- x
A
dreamletResultobject- coef
column number or column name specifying which coefficient or contrast of the linear model is of interest.
- genes
array of genes to include in plot
- assays
array of assay names to include in analysis. Defaults to
assayNames(x)- zmax
maximum z.std value
- transpose
(default: FALSE) Use `coord_flip()` to flip axies
Examples
library(muscat)
library(SingleCellExperiment)

data(example_sce)

# create pseudobulk for each sample and cell cluster
pb <- aggregateToPseudoBulk(example_sce,
  assay = "counts",
  cluster_id = "cluster_id",
  sample_id = "sample_id",
  verbose = FALSE
)

# voom-style normalization
res.proc <- processAssays(pb, ~group_id)
#>   B cells...
#> 0.064 secs
#>   CD14+ Monocytes...
#> 0.11 secs
#>   CD4 T cells...
#> 0.07 secs
#>   CD8 T cells...
#> 0.046 secs
#>   FCGR3A+ Monocytes...
#> 0.087 secs

# Differential expression analysis within each assay,
# evaluated on the voom normalized data
res.dl <- dreamlet(res.proc, ~group_id)
#>   B cells...
#> 0.056 secs
#>   CD14+ Monocytes...
#> 0.085 secs
#>   CD4 T cells...
#> 0.054 secs
#>   CD8 T cells...
#> 0.034 secs
#>   FCGR3A+ Monocytes...
#> 0.066 secs

# Heatmap for specified subset of genes
plotGeneHeatmap(res.dl, coef = "group_idstim", genes = rownames(pb)[1:15])
#> Warning: Removed 17 rows containing missing values or values outside the scale range
#> (`geom_text()`).