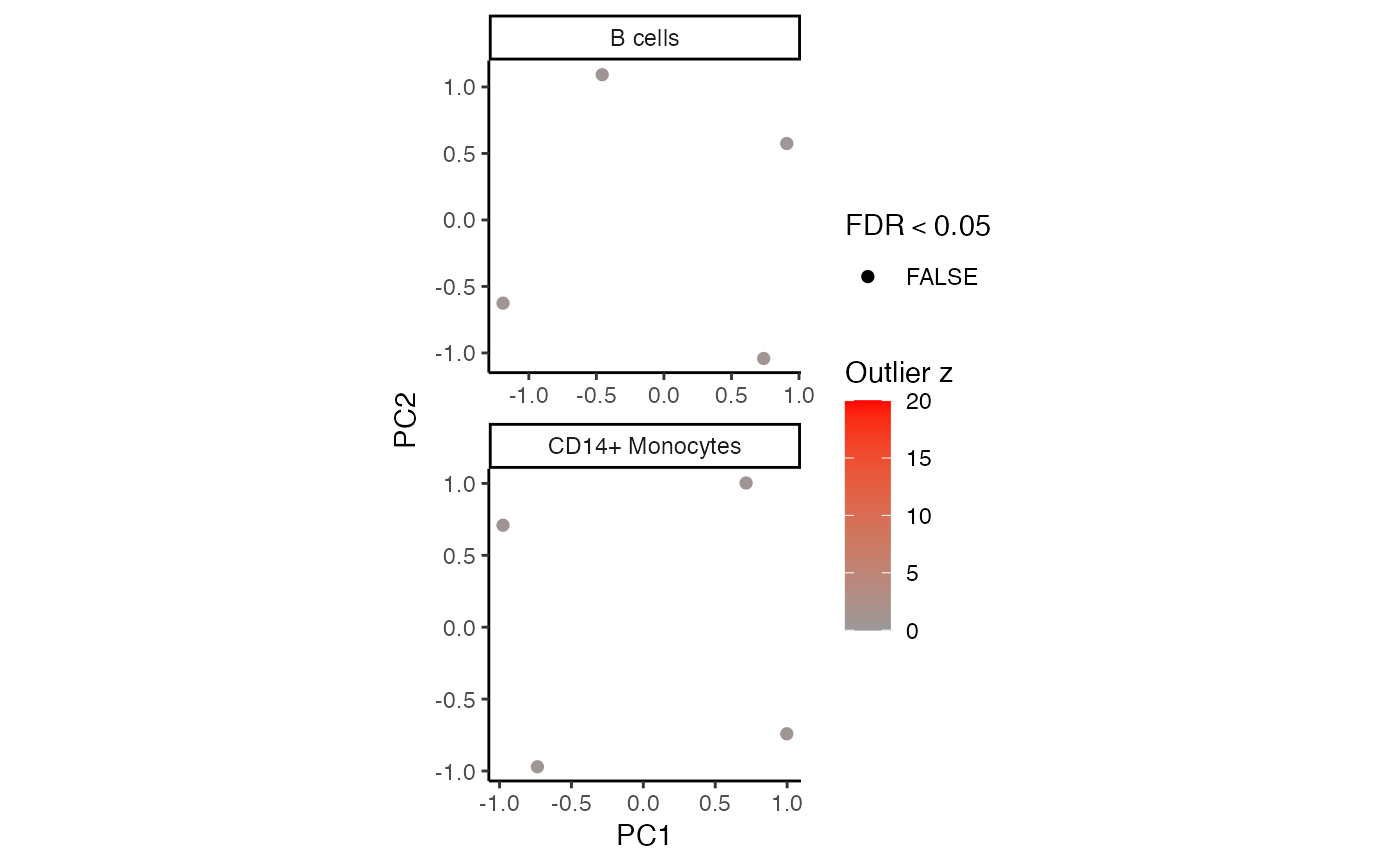
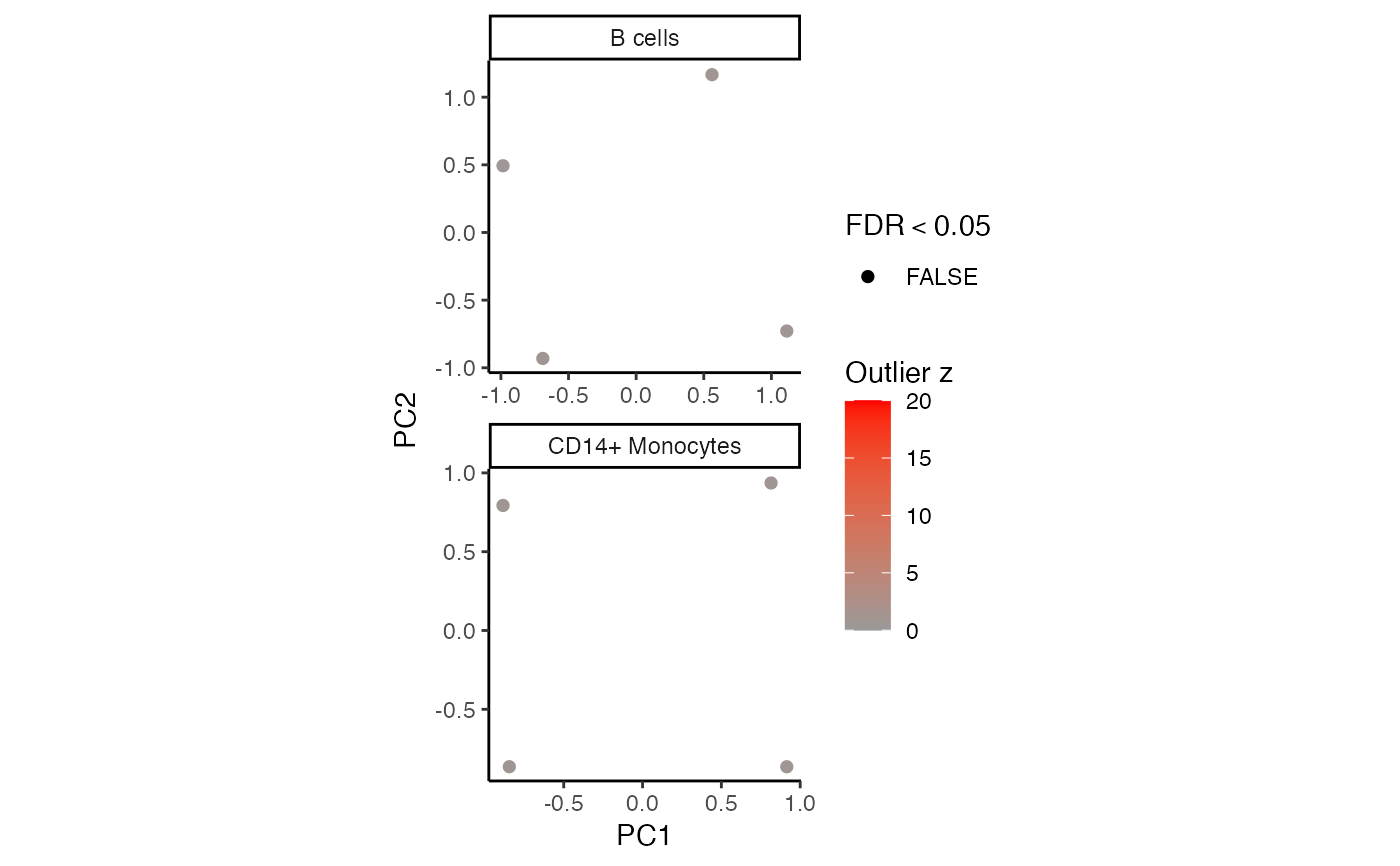
Compute PCA of gene expression for an assay, and plot samples coloring by outlier score
Usage
# S4 method for class 'list'
plotPCA(
  object,
  assays = names(object),
  nPC = 2,
  robust = FALSE,
  ...,
  maxOutlierZ = 20,
  nrow = 2,
  size = 2,
  fdr.cutoff = 0.05
)
Arguments
- object
dreamletProcessedDatafromprocessAssays()or alistfromresiduals()- assays
assays / cell types to analyze
- nPC
number of PCs to uses for outlier score with
outlier()- robust
use robust covariance method, defaults to
FALSE- ...
arguments passed to
MASS::cov.rob()- maxOutlierZ
cap outlier z-scores at this value for plotting to maintain consistent color scale
- nrow
number of rows in plot
- size
size passed to
geom_point()- fdr.cutoff
FDR cutoff to determine outlier
Examples
library(muscat)
library(SingleCellExperiment)

data(example_sce)

# create pseudobulk for each sample and cell cluster
pb <- aggregateToPseudoBulk(example_sce,
  assay = "counts",
  cluster_id = "cluster_id",
  sample_id = "sample_id",
  verbose = FALSE
)

# voom-style normalization
res.proc <- processAssays(pb, ~group_id)
#>   B cells...
#> 0.053 secs
#>   CD14+ Monocytes...
#> 0.084 secs
#>   CD4 T cells...
#> 0.06 secs
#>   CD8 T cells...
#> 0.036 secs
#>   FCGR3A+ Monocytes...
#> 0.079 secs

# PCA to identify outliers
# from normalized expression
plotPCA( res.proc, c("B cells", "CD14+ Monocytes"))


# Run on regression residuals
#-----------------------------

# Regression analysis
fit = dreamlet(res.proc, ~ group_id)
#>   B cells...
#> 0.048 secs
#>   CD14+ Monocytes...
#> 0.062 secs
#>   CD4 T cells...
#> 0.051 secs
#>   CD8 T cells...
#> 0.033 secs
#>   FCGR3A+ Monocytes...
#> 0.068 secs

# Extract regression residuals
residsObj = residuals(fit)

# PCA on residuals
plotPCA( residsObj, c("B cells", "CD14+ Monocytes"))
