Volcano plot for each cell type
Usage
plotVolcano(
  x,
  coef,
  nGenes = 5,
  size = 12,
  minp = 9.99999999999997e-311,
  cutoff = 0.05,
  ncol = 3,
  ...
)

# S4 method for class 'list'
plotVolcano(
  x,
  coef,
  nGenes = 5,
  size = 12,
  minp = 9.99999999999997e-311,
  cutoff = 0.05,
  ncol = 3,
  assays = names(x),
  ...
)

# S4 method for class 'MArrayLM'
plotVolcano(
  x,
  coef,
  nGenes = 5,
  size = 12,
  minp = 9.99999999999997e-311,
  cutoff = 0.05,
  ncol = 3,
  ...
)

# S4 method for class 'dreamlet_mash_result'
plotVolcano(
  x,
  coef,
  nGenes = 5,
  size = 12,
  minp = 1e-16,
  cutoff = 0.05,
  ncol = 3,
  assays = colnames(x$logFC.original),
  ...
)
Arguments
- x
result from
dreamlet- coef
coefficient to test with
topTable- nGenes
number of genes to highlight in each volcano plot
- size
text size
- minp
minimum p-value to show on the y-axis
- cutoff
adj.P.Val cutoff to distinguish significant from non-significant genes
- ncol
number of columns in the plot
- ...
arguments passed to
facet_wrap(). Useful for specifyingscales = "free_y"- assays
which assays to plot
Examples
library(muscat)
library(SingleCellExperiment)
data(example_sce)
# create pseudobulk for each sample and cell cluster
pb <- aggregateToPseudoBulk(example_sce,
assay = "counts",
cluster_id = "cluster_id",
sample_id = "sample_id",
verbose = FALSE
)
# voom-style normalization
res.proc <- processAssays(pb, ~group_id)
#> B cells...
#> 0.053 secs
#> CD14+ Monocytes...
#> 0.086 secs
#> CD4 T cells...
#> 0.065 secs
#> CD8 T cells...
#> 0.04 secs
#> FCGR3A+ Monocytes...
#> 0.095 secs
# Differential expression analysis within each assay,
# evaluated on the voom normalized data
res.dl <- dreamlet(res.proc, ~group_id)
#> B cells...
#> 0.048 secs
#> CD14+ Monocytes...
#> 0.063 secs
#> CD4 T cells...
#> 0.051 secs
#> CD8 T cells...
#> 0.033 secs
#> FCGR3A+ Monocytes...
#> 0.073 secs
# show coefficients estimated for each cell type
coefNames(res.dl)
#> [1] "(Intercept)" "group_idstim"
# volcano plot for each cell type
plotVolcano(res.dl, coef = "group_idstim")
#> Warning: Removed 1 row containing missing values or values outside the scale range
#> (`geom_text_repel()`).
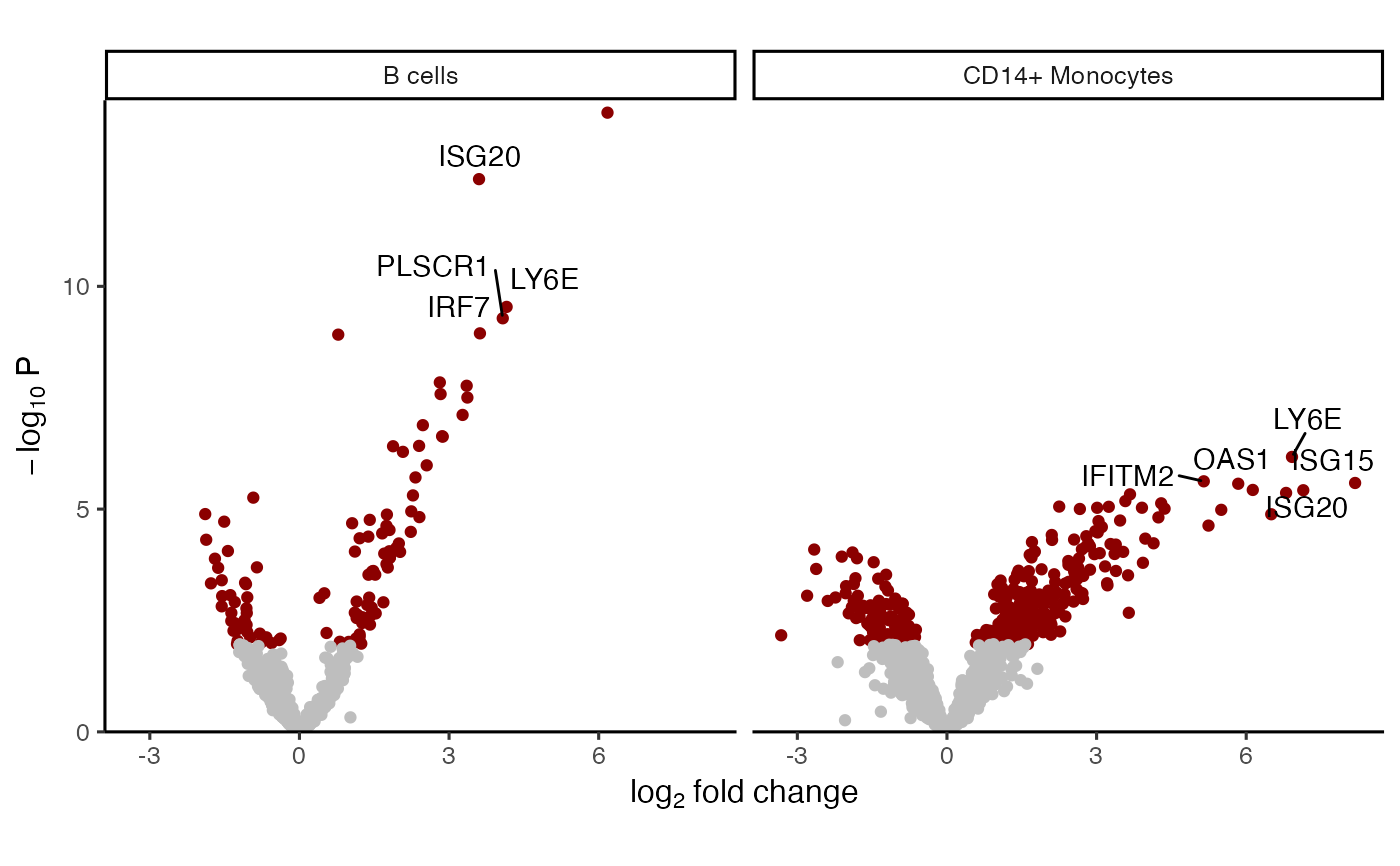
 # volcano plot for first two cell types
plotVolcano(res.dl[1:2], coef = "group_idstim")
#> Warning: Removed 1 row containing missing values or values outside the scale range
#> (`geom_text_repel()`).
# volcano plot for first two cell types
plotVolcano(res.dl[1:2], coef = "group_idstim")
#> Warning: Removed 1 row containing missing values or values outside the scale range
#> (`geom_text_repel()`).