Perform a competitive gene set analysis accounting for correlation between genes.
Usage
# S4 method for class 'dreamletResult,GeneSetCollection'
zenith_gsa(
  fit,
  geneSets,
  coefs,
  use.ranks = FALSE,
  n_genes_min = 10,
  inter.gene.cor = 0.01,
  progressbar = TRUE,
  ...
)

# S4 method for class 'dreamlet_mash_result,GeneSetCollection'
zenith_gsa(
  fit,
  geneSets,
  coefs,
  use.ranks = FALSE,
  n_genes_min = 10,
  inter.gene.cor = 0.01,
  progressbar = TRUE,
  ...
)
Arguments
- fit
results from
dreamlet()- geneSets
GeneSetCollection- coefs
coefficients to test using
topTable(fit, coef=coefs[i])- use.ranks
do a rank-based test
TRUEor a parametric testFALSE? default: FALSE- n_genes_min
minimum number of genes in a geneset
- inter.gene.cor
if NA, estimate correlation from data. Otherwise, use specified value
- progressbar
if TRUE, show progress bar
- ...
other arguments
Value
data.frame of results for each gene set and cell type
data.frame of results for each gene set and cell type
Details
This code adapts the widely used camera() analysis (Wu and Smyth 2012)
in the limma package (Ritchie et al. 2015)
to the case of linear (mixed) models used by variancePartition::dream().
Examples
library(muscat)
library(SingleCellExperiment)
data(example_sce)
# create pseudobulk for each sample and cell cluster
pb <- aggregateToPseudoBulk(example_sce,
assay = "counts",
cluster_id = "cluster_id",
sample_id = "sample_id",
verbose = FALSE
)
# voom-style normalization
res.proc <- processAssays(pb, ~group_id)
#> B cells...
#> 0.054 secs
#> CD14+ Monocytes...
#> 0.085 secs
#> CD4 T cells...
#> 0.062 secs
#> CD8 T cells...
#> 0.037 secs
#> FCGR3A+ Monocytes...
#> 0.08 secs
# Differential expression analysis within each assay,
# evaluated on the voom normalized data
res.dl <- dreamlet(res.proc, ~group_id)
#> B cells...
#> 0.049 secs
#> CD14+ Monocytes...
#> 0.074 secs
#> CD4 T cells...
#> 0.051 secs
#> CD8 T cells...
#> 0.032 secs
#> FCGR3A+ Monocytes...
#> 0.06 secs
# Load Gene Ontology database
# use gene 'SYMBOL', or 'ENSEMBL' id
# use get_MSigDB() to load MSigDB
library(zenith)
go.gs <- get_GeneOntology("CC", to = "SYMBOL")
#>
#>
# Run zenith gene set analysis on result of dreamlet
res_zenith <- zenith_gsa(res.dl, go.gs, "group_idstim", progressbar = FALSE)
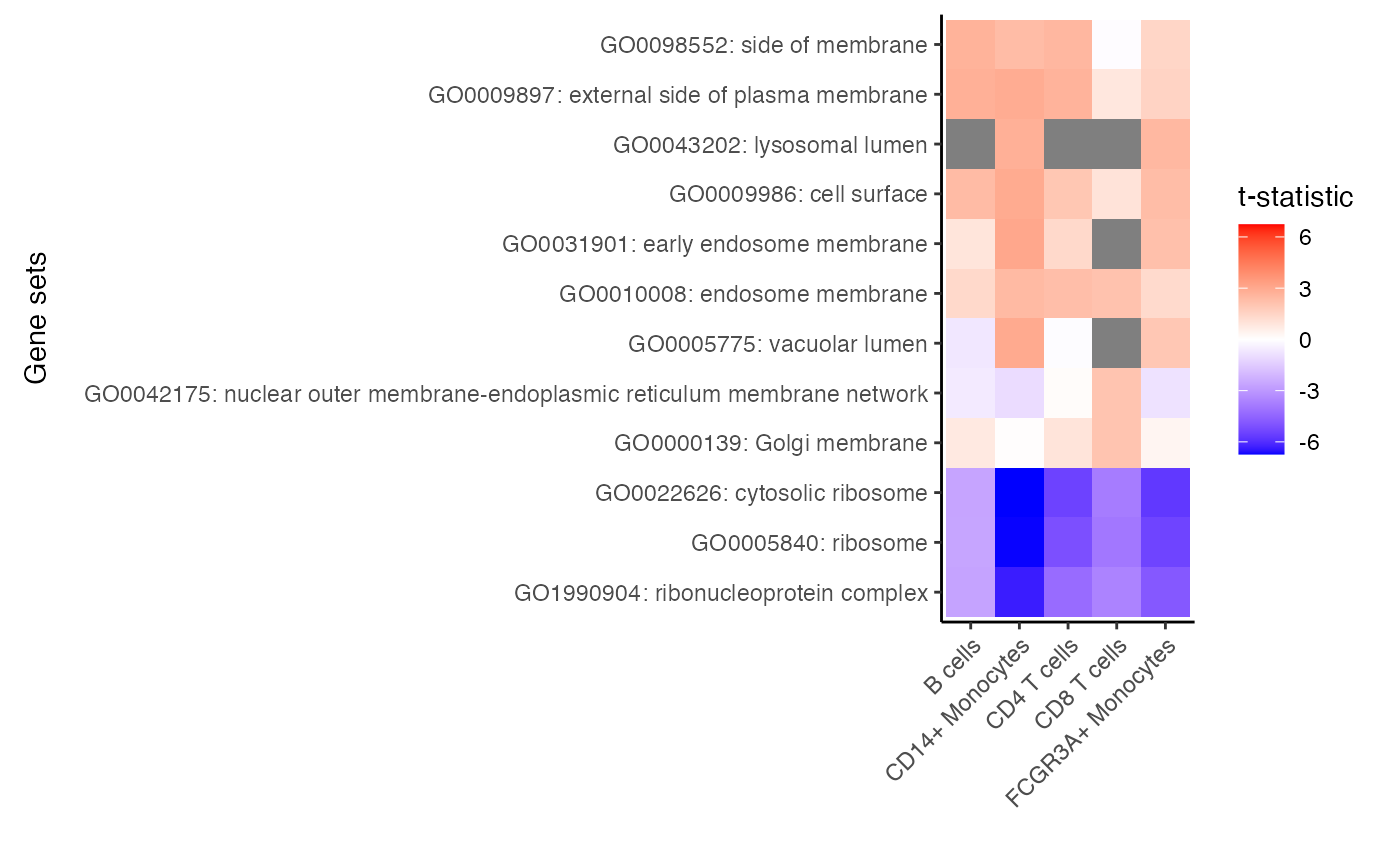
# for each cell type select 3 genesets with largest t-statistic
# and 1 geneset with the lowest
# Grey boxes indicate the gene set could not be evaluted because
# to few genes were represented
plotZenithResults(res_zenith, 3, 1)
#> Warning: Removed 5 rows containing missing values or values outside the scale range
#> (`geom_text()`).