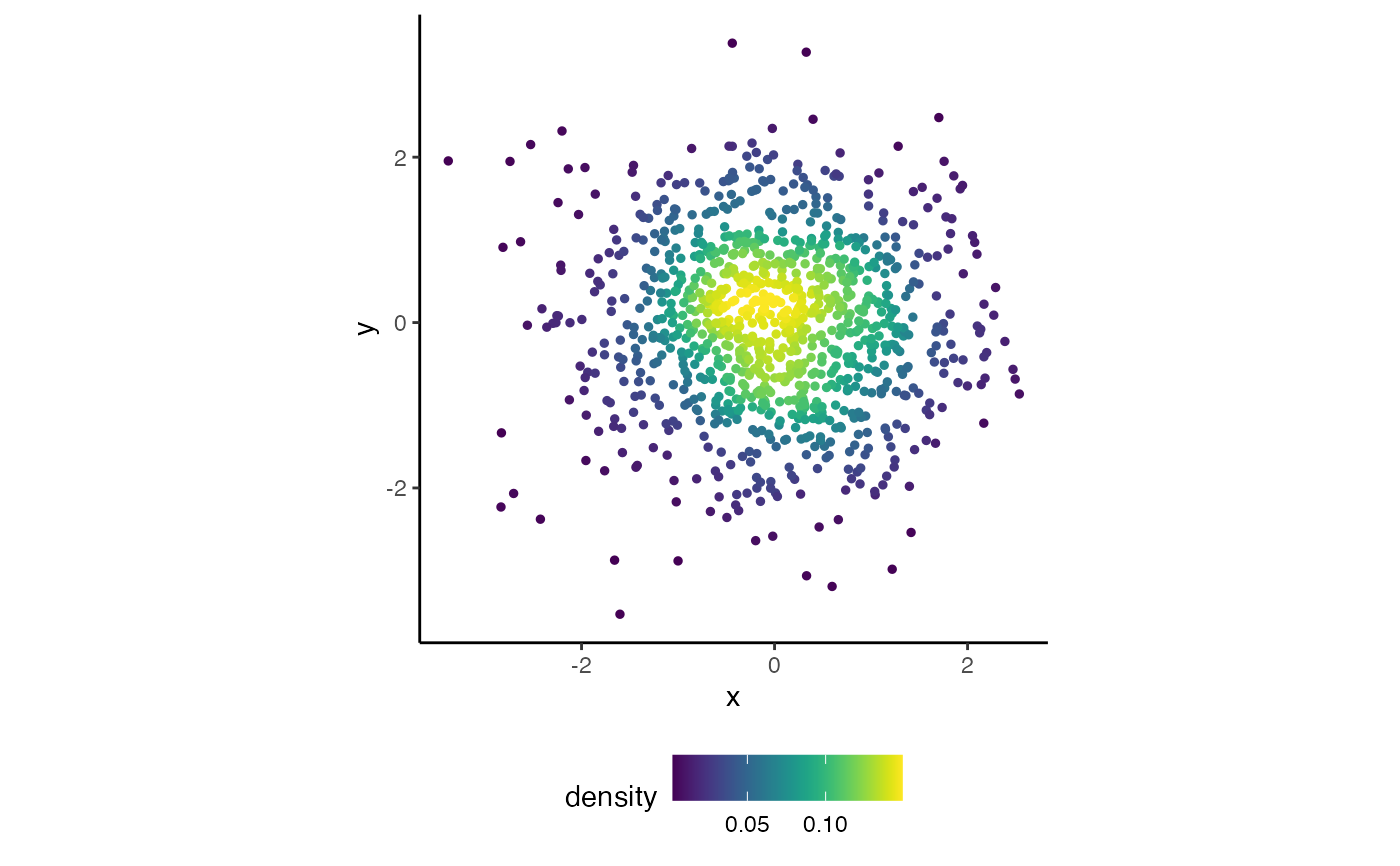
Scatter plot with 2D density using viridis colors
Usage
plotScatterDensity(x, y, size = 1)
Arguments
- x
the x-coordinates of points in the plot
- y
the y-coordinates of points in the plot
- size
size of point
Examples
# simulate data
M <- Rfast::rmvnorm(1000, mu = c(0, 0), sigma = diag(1, 2))

# create 2D density plot
plotScatterDensity(M[, 1], M[, 2])