For each gene, compute fraction of overall expression attributable to each cell type
Arguments
- pb
SingleCellExperimentof pseudobulk data where easyassayis a cell type.- ...
other arguments passed to
edgeR::calcNormFactors()
Details
Sum counts for each cell type, and compute the fraction of counts-per-million attributable to each cell type for each gene
Examples
library(muscat)
library(SingleCellExperiment)
data(example_sce)
# create pseudobulk for each sample and cell cluster
pb <- aggregateToPseudoBulk(example_sce,
assay = "counts",
cluster_id = "cluster_id",
sample_id = "sample_id",
verbose = FALSE
)
# Compute cell type specificity of each gene
df <- cellTypeSpecificity(pb)
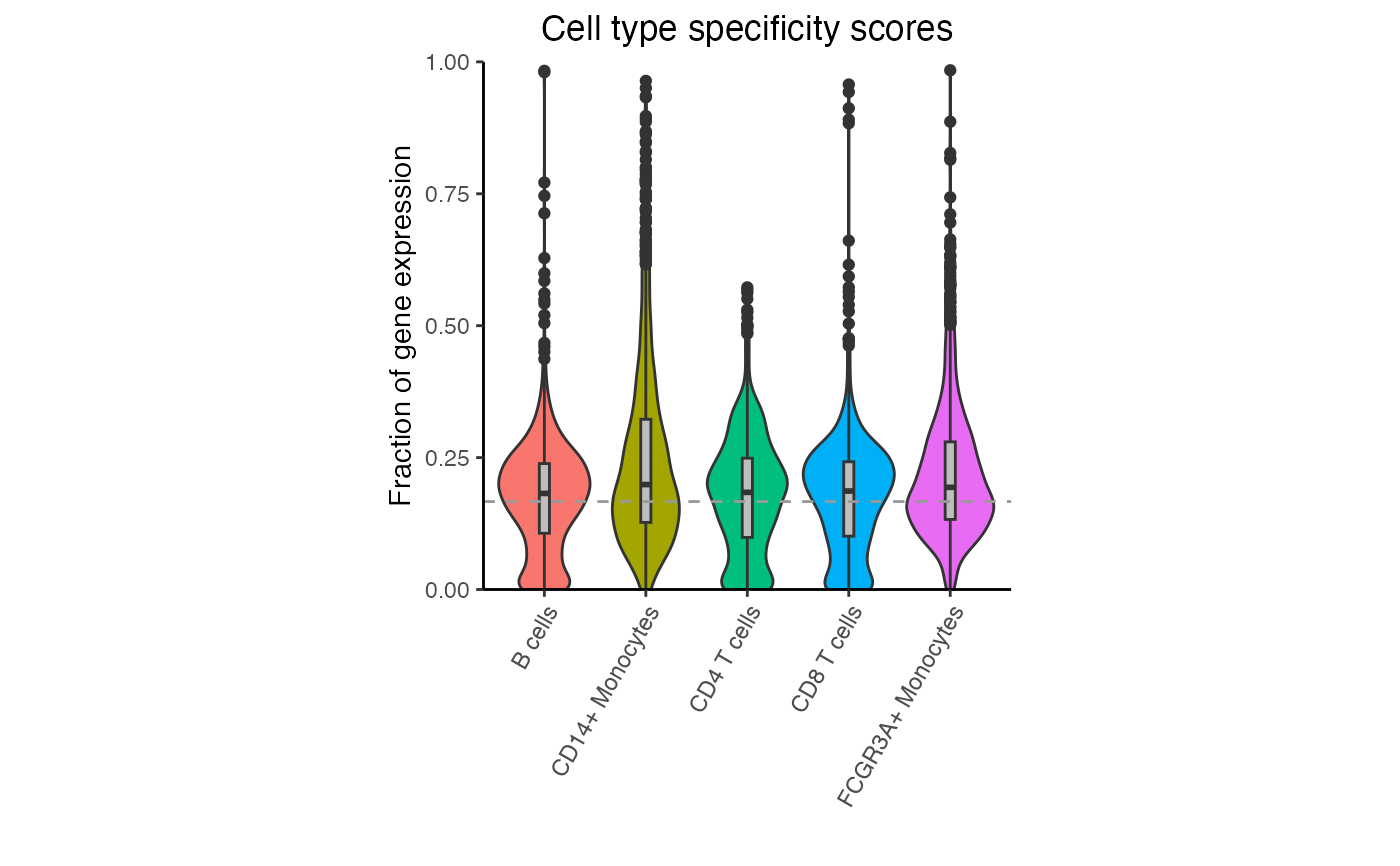
# Violin plot of specificity scores for each cell type
# Dashed line indicates genes that are equally expressed
# across all cell types. For K cell types, this is 1/K
plotViolin(df)
 # Compute the maximum specificity score for each gene
scoreMax <- apply(df, 1, max)
head(scoreMax)
#> HES4 ISG15 AURKAIP1 MRPL20 SSU72 RER1
#> 585.0935 61555.5769 1012.0795 644.9976 835.4867 1049.8381
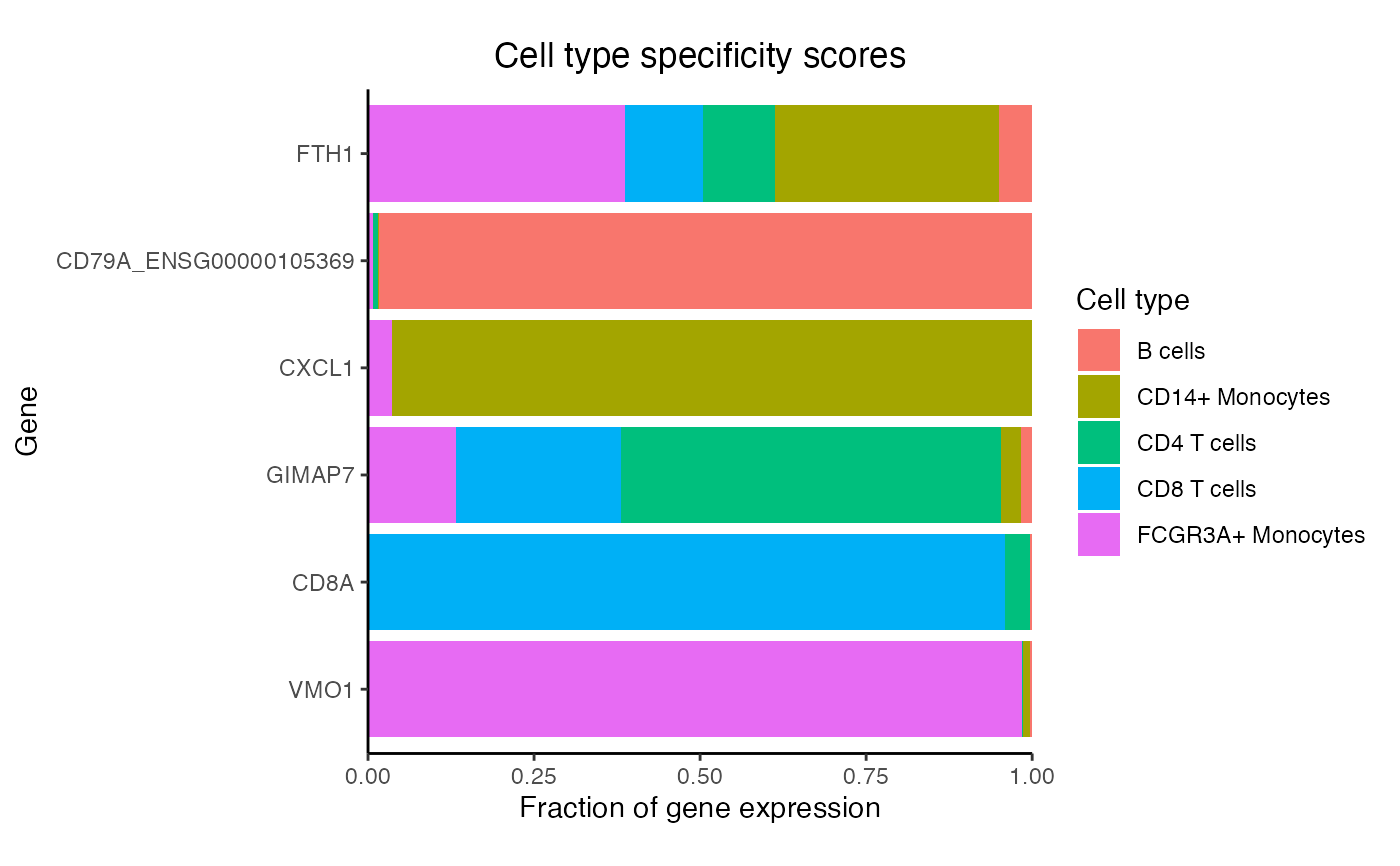
# For each cell type, get most specific gene
genes <- rownames(df)[apply(df, 2, which.max)]
# Barplot of 5 genes
plotPercentBars(df, genes = genes)
# Compute the maximum specificity score for each gene
scoreMax <- apply(df, 1, max)
head(scoreMax)
#> HES4 ISG15 AURKAIP1 MRPL20 SSU72 RER1
#> 585.0935 61555.5769 1012.0795 644.9976 835.4867 1049.8381
# For each cell type, get most specific gene
genes <- rownames(df)[apply(df, 2, which.max)]
# Barplot of 5 genes
plotPercentBars(df, genes = genes)
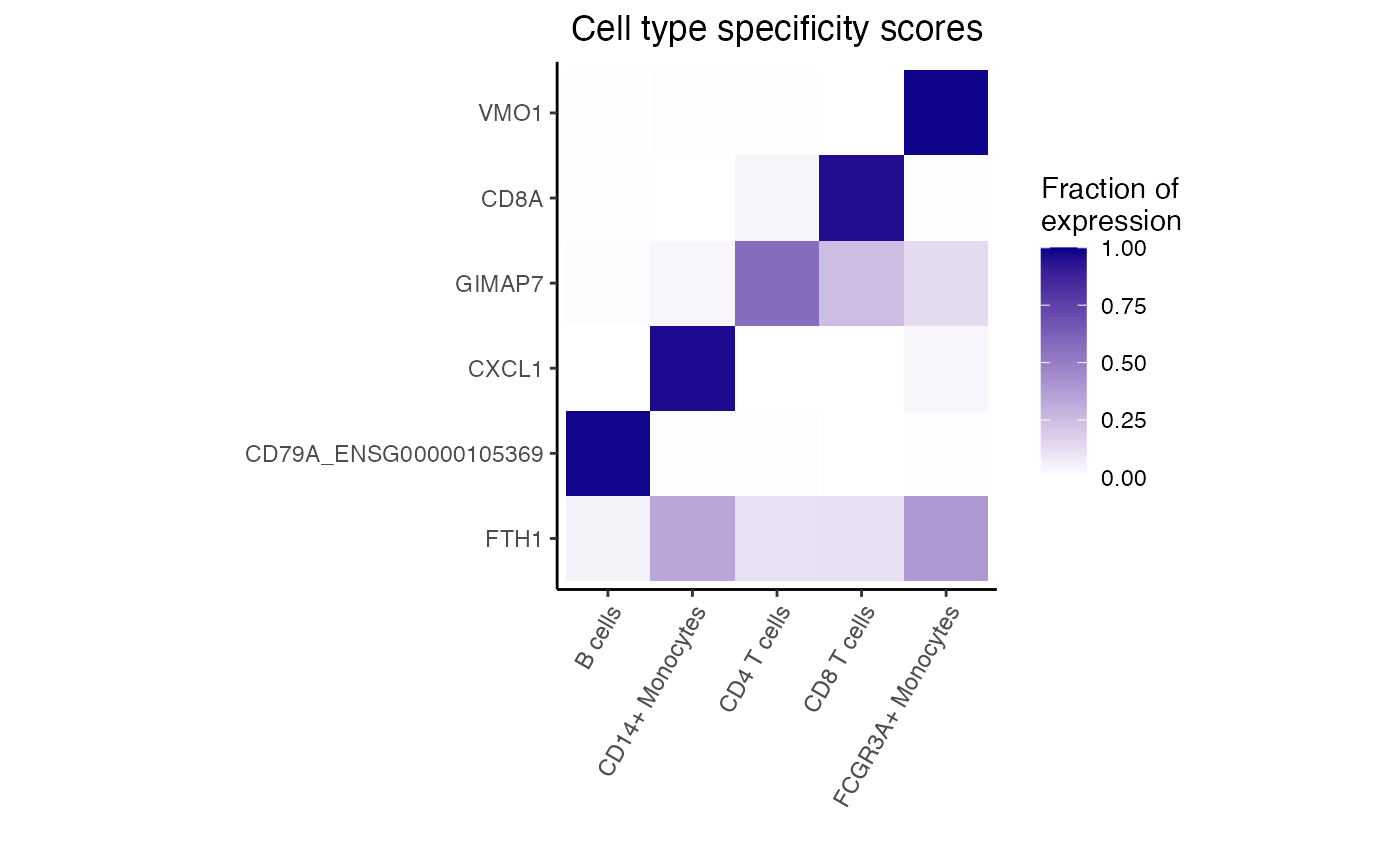
 # heatmap of 5 genes that are most cell type specific
dreamlet::plotHeatmap(df, genes = genes)
# heatmap of 5 genes that are most cell type specific
dreamlet::plotHeatmap(df, genes = genes)