Plot Violins
Usage
plotViolin(x, ...)

# S4 method for class 'cellSpecificityValues'
plotViolin(x, assays = colnames(x))Examples
library(muscat)
library(SingleCellExperiment)
data(example_sce)
# create pseudobulk for each sample and cell cluster
pb <- aggregateToPseudoBulk(example_sce,
assay = "counts",
cluster_id = "cluster_id",
sample_id = "sample_id",
verbose = FALSE
)
# Compute cell type specificity of each gene
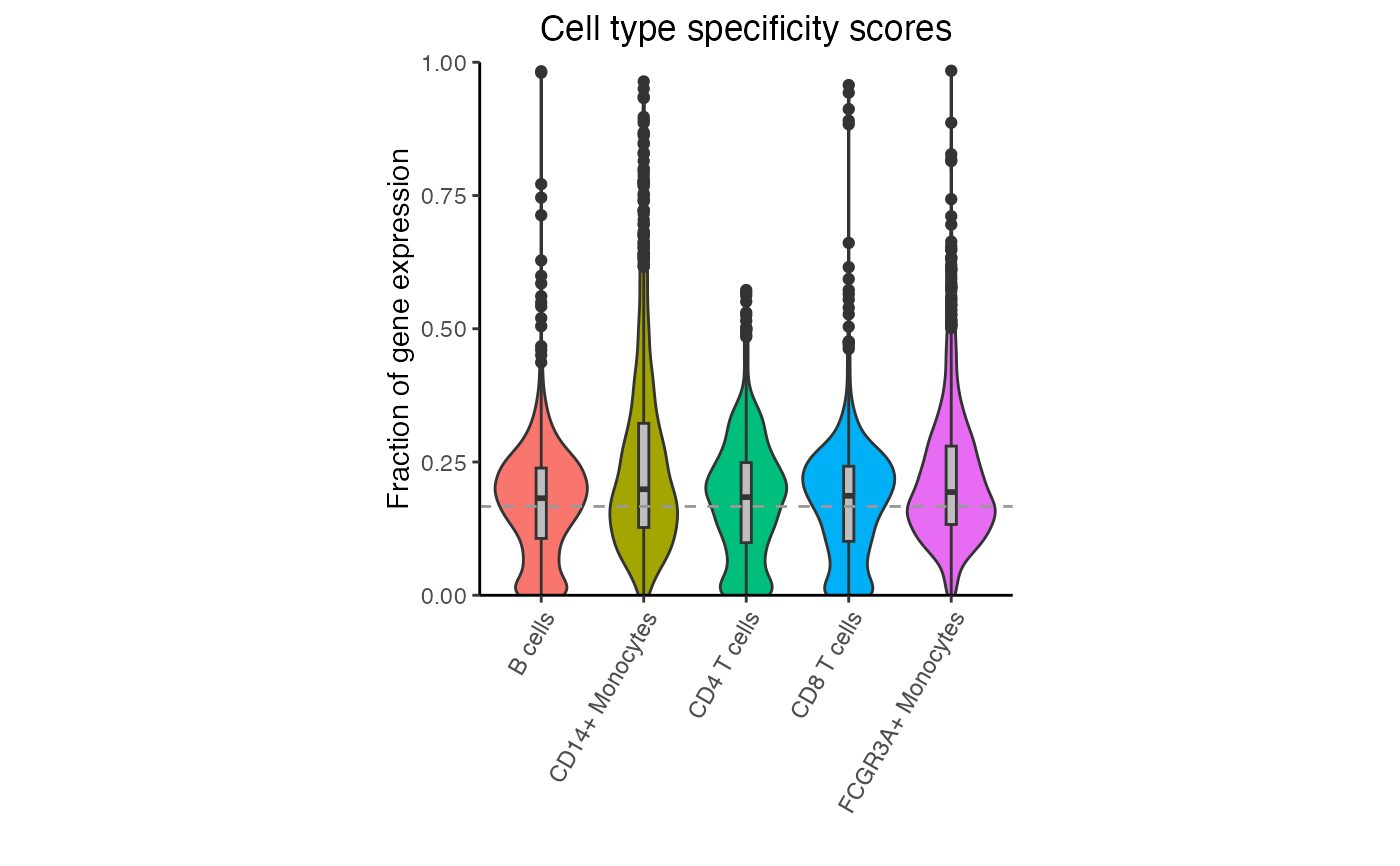
df <- cellTypeSpecificity(pb)
# Violin plot of specificity scores for each cell type
# Dashed line indicates genes that are equally expressed
# across all cell types. For K cell types, this is 1/K
plotViolin(df)