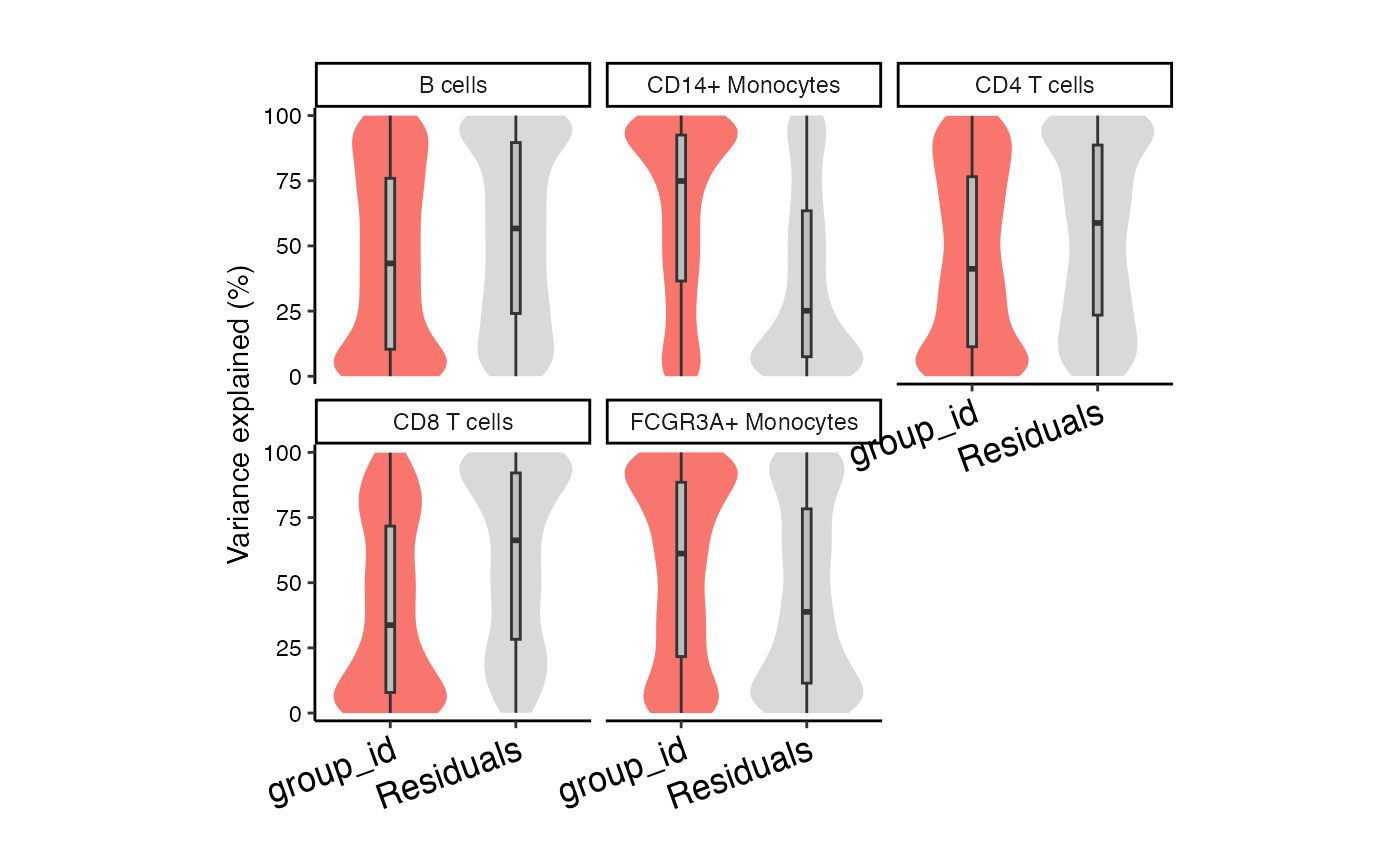
Violin plot of variance fraction for each gene and each variable
Usage
# S4 method for class 'DataFrame'
plotVarPart(
  obj,
  col = c(ggColorHue(base::ncol(obj) - 3), "grey85"),
  label.angle = 20,
  main = "",
  ylab = "",
  convertToPercent = TRUE,
  ncol = 3,
  ...
)Examples
library(muscat)
library(SingleCellExperiment)

data(example_sce)

# create pseudobulk for each sample and cell cluster
pb <- aggregateToPseudoBulk(example_sce,
  assay = "counts",
  cluster_id = "cluster_id",
  sample_id = "sample_id",
  verbose = FALSE
)

# voom-style normalization
res.proc <- processAssays(pb, ~group_id)
#>   B cells...
#> 0.053 secs
#>   CD14+ Monocytes...
#> 0.085 secs
#>   CD4 T cells...
#> 0.062 secs
#>   CD8 T cells...
#> 0.037 secs
#>   FCGR3A+ Monocytes...
#> 0.081 secs

# variance partitioning analysis
vp <- fitVarPart(res.proc, ~group_id)
#>   B cells...
#> 0.61 secs
#>   CD14+ Monocytes...
#> 0.81 secs
#>   CD4 T cells...
#> 0.64 secs
#>   CD8 T cells...
#> 0.38 secs
#>   FCGR3A+ Monocytes...
#> 0.77 secs
#>

# Summarize variance fractions genome-wide for each cell type
plotVarPart(vp)