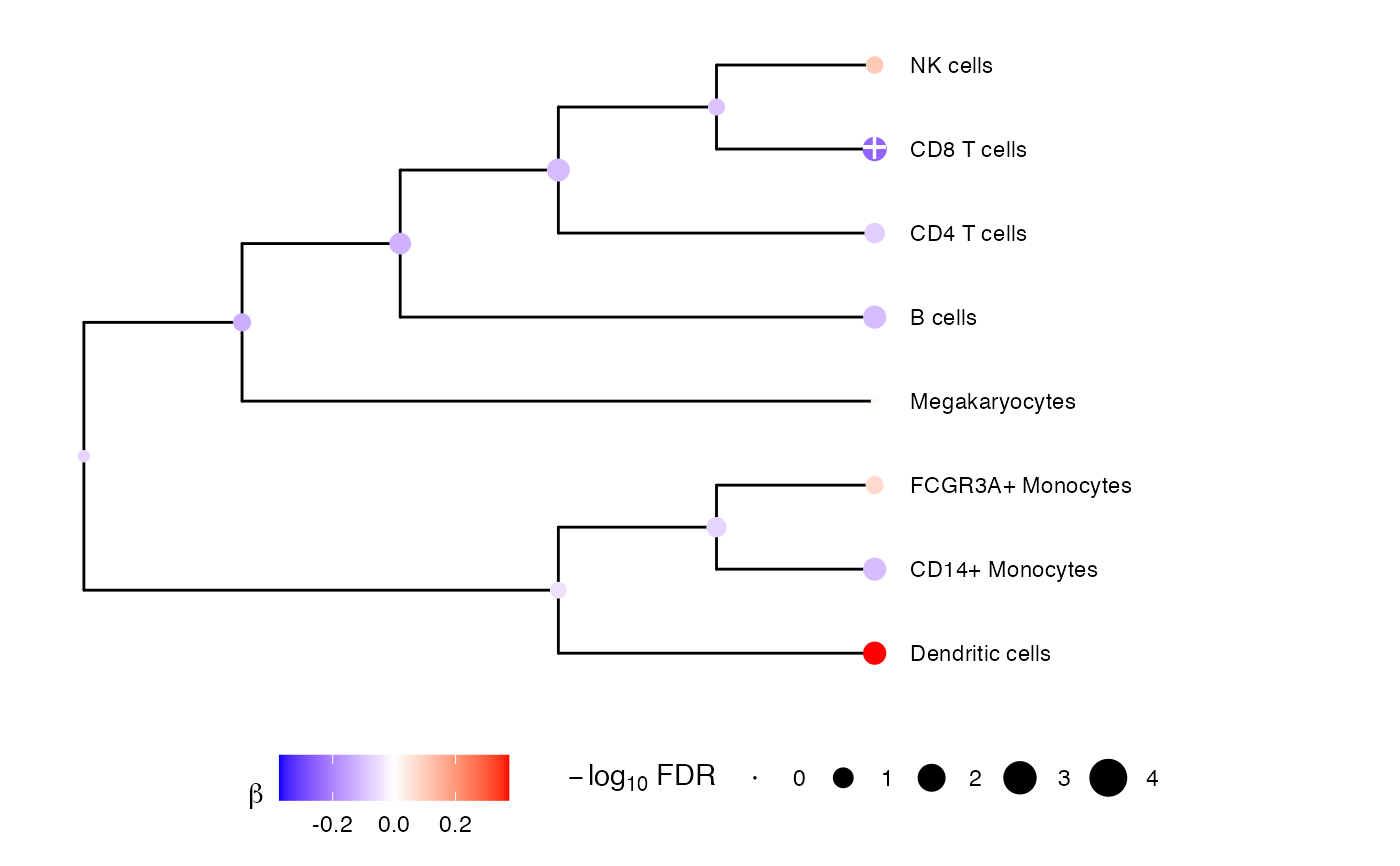
Plot tree coefficients from multivariate testing at each node. Only applicable top fixed effect tests
Usage
plotTreeTestBeta(
  tree,
  low = "blue",
  mid = "white",
  high = "red",
  xmax.scale = 1.5,
  fdr.cutoff = 0.05
)Examples
library(variancePartition)

# Load cell counts, clustering and metadata
# from Kang, et al. (2018) https://doi.org/10.1038/nbt.4042
data(IFNCellCounts)

# Apply crumblr transformation
cobj <- crumblr(df_cellCounts)

# Use dream workflow to analyze each cell separately
fit <- dream(cobj, ~ StimStatus + ind, info)
fit <- eBayes(fit)

# Perform multivariate test across the hierarchy
res <- treeTest(fit, cobj, hcl, coef = "StimStatusstim")

# Plot hierarchy, no tests are significant at FDR < 0.05
plotTreeTestBeta(res)